> ## Documentation Index
> Fetch the complete documentation index at: https://docs.revyl.com/llms.txt
> Use this file to discover all available pages before exploring further.
# Reports
> Every run produces a report: video, timeline, performance, network, and logs
Every test run generates a report. You get the full video recording, a step-by-step timeline, and deep inspection of what happened on the device: performance metrics, network traffic, and device logs.
 ## Page Layout
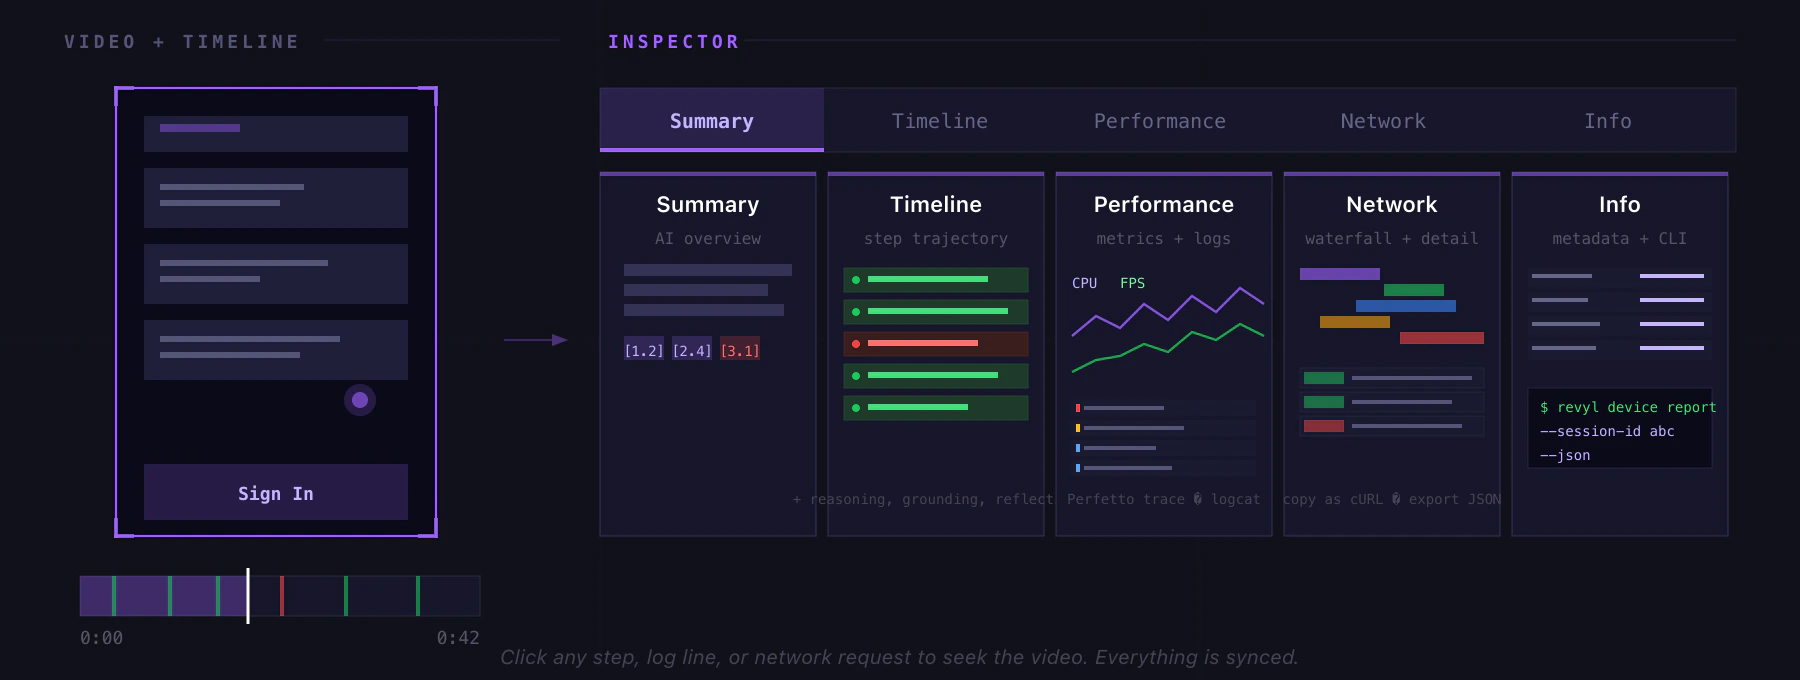
The report has a video player on top (with a scrubbable timeline underneath spanning the full width) and a tabbed inspector on the right. Click any step in the timeline or any log/request to jump the video to that exact moment.
## Tabs
### Summary
An AI-generated overview of the run: what the test was trying to do, plus a numbered list of key moments. Each moment has a clickable reference (like `[3.2]`) that seeks the video. Failures get a dedicated call-out.
### Timeline
The step-by-step agent trajectory. Click any step to see the full details in a focus panel: AI reasoning, timing, grounding screenshot (the bounding-box the agent targeted), reflection feedback, and structured action data (what it tapped, what it typed, etc).
Navigate with arrow keys. Use `[` and `]` to jump between failures.
### Performance
Split view with a hardware metrics chart on top and device logs on the bottom.
**Hardware Metrics** - toggle any of these series on the chart:
* **CPU %** - app CPU usage
* **FPS** - frame rate
* **App RSS** - resident set size (MB)
* **App VSS** - virtual size (MB)
* **System Mem %** - overall device memory pressure
The chart is synced with the video: click anywhere to seek. Step executions appear as shaded regions (red for failures). Memory warnings and app terminations are marked as dashed lines. Drag to zoom a time range, which also filters the logs below.
Peak CPU, peak memory, and average FPS are shown at the top. For Android runs, download the full **Perfetto trace** and open it in [ui.perfetto.dev](https://ui.perfetto.dev) for frame-level profiling.
**Device Logs** (Logcat / iOS syslog) - color-coded by severity:
* Filter chips for Error, Warning, Info, Debug (with counts)
* Free-text search across log content
* Click any line to seek the video
* Copy filtered lines to clipboard
* Download the raw log archive
The currently-playing log line highlights purple and auto-scrolls with the video.
### Network
All HTTP and WebSocket traffic from the device, classified and filterable.
**Top bar**: filter by request type (API, Img, Script, Auth, Font, Media, Doc, WS, Other) and search by URL.
**Waterfall**: timeline of requests as colored bars. Drag to zoom a time window, which filters the table below.
**Request table**: every request with status, type, size, duration, and video-relative timestamp. Click a row to:
* Seek the video to that request
* Open a detail pane with tabs for **Headers**, **Payload**, **Preview** (images/fonts/media), **Timing** (DNS/Connect/TLS/TTFB breakdown), and **Response**
* **Copy as cURL** to reproduce the request locally
Footer shows total requests, bytes transferred, and failed count. Download the full `network_requests.json.gz` for offline analysis.
### Info
Metadata grid with copy-to-clipboard on every value:
* **Execution Details**: timestamp, duration, platform, validations passed
* **App Information**: app name and build version (clickable, link to the App and Build)
* **Device Information**: device type, resolution, runtime, platform
* **Test Information**: test name, test ID, execution ID, trace ID, and test version (open the YAML of blocks as they existed at run time)
* **CLI snippets**: `revyl device report --session-id --json` to fetch the report data for scripting
## Video Player
Spacebar to play/pause. Click the timeline to scrub. Use `F` to toggle fullscreen. Press `H` to cycle playback speed (up to 8x on most browsers, 2x for Android on Safari).
Toggle the **action overlay** to see taps, swipes, and text input animated on top of the video as they happened.
## Sharing
Click **Share** in the header:
* **Team link**: requires login, sends the recipient straight to the report in-app
* **Public link**: anyone with the link can view without logging in. Choose expiration: 1 day, 7 days, 30 days, 90 days, or never. Delete or regenerate at any time.
## Exports
| What | Where | Format |
| ------------------------ | ----------------------------- | ------------------- |
| Device logs | Performance tab toolbar | `.txt` or `.txt.gz` |
| Perfetto trace (Android) | Hardware metrics chart header | `.perfetto-trace` |
| Network requests | Network tab footer | `.json.gz` |
| cURL for any request | Network detail → Headers tab | Clipboard |
| Log lines | Performance tab toolbar | Clipboard |
## Keyboard Shortcuts
| Key | Action |
| --------------- | ----------------------- |
| `Space` | Play / pause |
| `←` / `→` | Previous / next step |
| `[` / `]` | Previous / next failure |
| `F` | Fullscreen |
| `H` | Cycle playback speed |
| `1` / `2` / `3` | Switch tabs |
## Accessing Reports
* From **Tests**, click any test row, then **View Runs** for historical reports
* From the [test editor](/tests/creating-tests/test-editor), click the history icon
* From a [workflow](/tests/workflows) run, click into any test result
## Page Layout
The report has a video player on top (with a scrubbable timeline underneath spanning the full width) and a tabbed inspector on the right. Click any step in the timeline or any log/request to jump the video to that exact moment.
## Tabs
### Summary
An AI-generated overview of the run: what the test was trying to do, plus a numbered list of key moments. Each moment has a clickable reference (like `[3.2]`) that seeks the video. Failures get a dedicated call-out.
### Timeline
The step-by-step agent trajectory. Click any step to see the full details in a focus panel: AI reasoning, timing, grounding screenshot (the bounding-box the agent targeted), reflection feedback, and structured action data (what it tapped, what it typed, etc).
Navigate with arrow keys. Use `[` and `]` to jump between failures.
### Performance
Split view with a hardware metrics chart on top and device logs on the bottom.
**Hardware Metrics** - toggle any of these series on the chart:
* **CPU %** - app CPU usage
* **FPS** - frame rate
* **App RSS** - resident set size (MB)
* **App VSS** - virtual size (MB)
* **System Mem %** - overall device memory pressure
The chart is synced with the video: click anywhere to seek. Step executions appear as shaded regions (red for failures). Memory warnings and app terminations are marked as dashed lines. Drag to zoom a time range, which also filters the logs below.
Peak CPU, peak memory, and average FPS are shown at the top. For Android runs, download the full **Perfetto trace** and open it in [ui.perfetto.dev](https://ui.perfetto.dev) for frame-level profiling.
**Device Logs** (Logcat / iOS syslog) - color-coded by severity:
* Filter chips for Error, Warning, Info, Debug (with counts)
* Free-text search across log content
* Click any line to seek the video
* Copy filtered lines to clipboard
* Download the raw log archive
The currently-playing log line highlights purple and auto-scrolls with the video.
### Network
All HTTP and WebSocket traffic from the device, classified and filterable.
**Top bar**: filter by request type (API, Img, Script, Auth, Font, Media, Doc, WS, Other) and search by URL.
**Waterfall**: timeline of requests as colored bars. Drag to zoom a time window, which filters the table below.
**Request table**: every request with status, type, size, duration, and video-relative timestamp. Click a row to:
* Seek the video to that request
* Open a detail pane with tabs for **Headers**, **Payload**, **Preview** (images/fonts/media), **Timing** (DNS/Connect/TLS/TTFB breakdown), and **Response**
* **Copy as cURL** to reproduce the request locally
Footer shows total requests, bytes transferred, and failed count. Download the full `network_requests.json.gz` for offline analysis.
### Info
Metadata grid with copy-to-clipboard on every value:
* **Execution Details**: timestamp, duration, platform, validations passed
* **App Information**: app name and build version (clickable, link to the App and Build)
* **Device Information**: device type, resolution, runtime, platform
* **Test Information**: test name, test ID, execution ID, trace ID, and test version (open the YAML of blocks as they existed at run time)
* **CLI snippets**: `revyl device report --session-id --json` to fetch the report data for scripting
## Video Player
Spacebar to play/pause. Click the timeline to scrub. Use `F` to toggle fullscreen. Press `H` to cycle playback speed (up to 8x on most browsers, 2x for Android on Safari).
Toggle the **action overlay** to see taps, swipes, and text input animated on top of the video as they happened.
## Sharing
Click **Share** in the header:
* **Team link**: requires login, sends the recipient straight to the report in-app
* **Public link**: anyone with the link can view without logging in. Choose expiration: 1 day, 7 days, 30 days, 90 days, or never. Delete or regenerate at any time.
## Exports
| What | Where | Format |
| ------------------------ | ----------------------------- | ------------------- |
| Device logs | Performance tab toolbar | `.txt` or `.txt.gz` |
| Perfetto trace (Android) | Hardware metrics chart header | `.perfetto-trace` |
| Network requests | Network tab footer | `.json.gz` |
| cURL for any request | Network detail → Headers tab | Clipboard |
| Log lines | Performance tab toolbar | Clipboard |
## Keyboard Shortcuts
| Key | Action |
| --------------- | ----------------------- |
| `Space` | Play / pause |
| `←` / `→` | Previous / next step |
| `[` / `]` | Previous / next failure |
| `F` | Fullscreen |
| `H` | Cycle playback speed |
| `1` / `2` / `3` | Switch tabs |
## Accessing Reports
* From **Tests**, click any test row, then **View Runs** for historical reports
* From the [test editor](/tests/creating-tests/test-editor), click the history icon
* From a [workflow](/tests/workflows) run, click into any test result