

main or staging Atlas current, use the post-merge CI,
weekly CI or Cursor setup recipes.
Feature-branch builds and PR merges do not move evidence into those branches;
the routine builds the intended source and explores that exact build.
How Atlas Gets Data
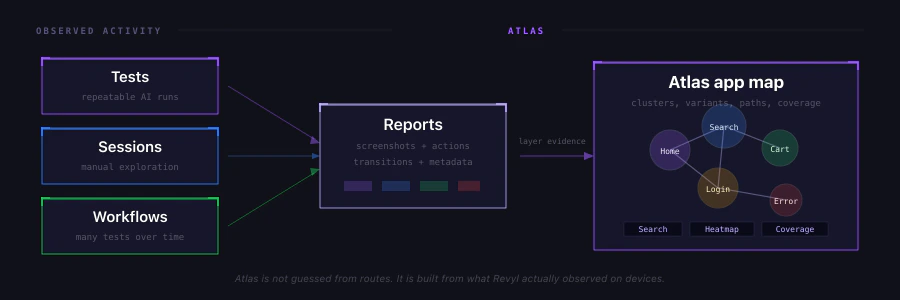
Atlas is built from real device observations. Test runs, workflows, and exploratory sessions produce reports with screenshots, actions, transitions, and metadata. Atlas layers that evidence into an app-level graph. Atlas groups similar screens together even when the content changes, so the map stays focused on your app’s structure instead of every user, list item, or loading state. A newly uploaded build may have no Atlas data until at least one run or session observes it. After a run completes, Atlas can also lag briefly while report data is processed.Dashboard
Open an app and go to Atlas to see the app-level map. From a report, use the Atlas action to jump into the map filtered to the app and build that produced the run. Atlas opens on All branches unless a link selects a branch or an exact build. The default window, Recent 20, uses the 20 most recently uploaded builds inside that scope. Switch branches or choose All branches, then narrow by time window or specific build. The same control can narrow the map to an observed device model, runtime, or exact device/runtime combination. Share links keep the selected scope. Branches filter the evidence shown, including transitions. Screen merges, hiding, and identity-root changes remain app-wide. Observations without a known build appear only in All. To comparemain with a feature branch, see
Compare two branches.
The dashboard view is best for visual review: scan major areas, inspect screenshots, and follow transitions between screens.
To discover more of the app automatically, use Explore your app to launch parallel explorers from the dashboard.
Terms and View Options
Atlas uses a few map-specific terms:- Screen cluster - one logical screen, grouped from many observed screenshots that appear to be the same place in the app.
- Variant - a related state of a screen, such as loading, empty, logged-out, error, permission prompt, or populated content.
- Observation - one real screenshot/action moment from a test run or session.
- Transition - a path between screens, usually tied to the tap, swipe, or other action that moved the app forward.
- Coverage - the set of screens and transitions touched by a test, workflow, session, build, or time window.
- Product area - an Atlas grouping for screens that belong to the same part of the app, such as onboarding, checkout, or settings.
- Map - shows the app as a flow graph, useful for seeing how screens connect.
- Grid - shows the same screen clusters without the graph layout, useful for scanning screenshots quickly.
- Show variants - expands each screen into its observed states so you can inspect edge cases and dynamic UI.
- Heat - colors screens and paths by activity density, making frequently observed areas stand out.
- Clusters - draws product-area groupings behind the graph so large maps are easier to reason about.
- Layout - automatically uses left-to-right for deep flows and top-to-bottom for broad maps. Select the layout control to override the automatic direction.
- Details panel - opens when you select a screen and shows screenshots, variants, evidence, and incoming/outgoing transitions.