Page Layout
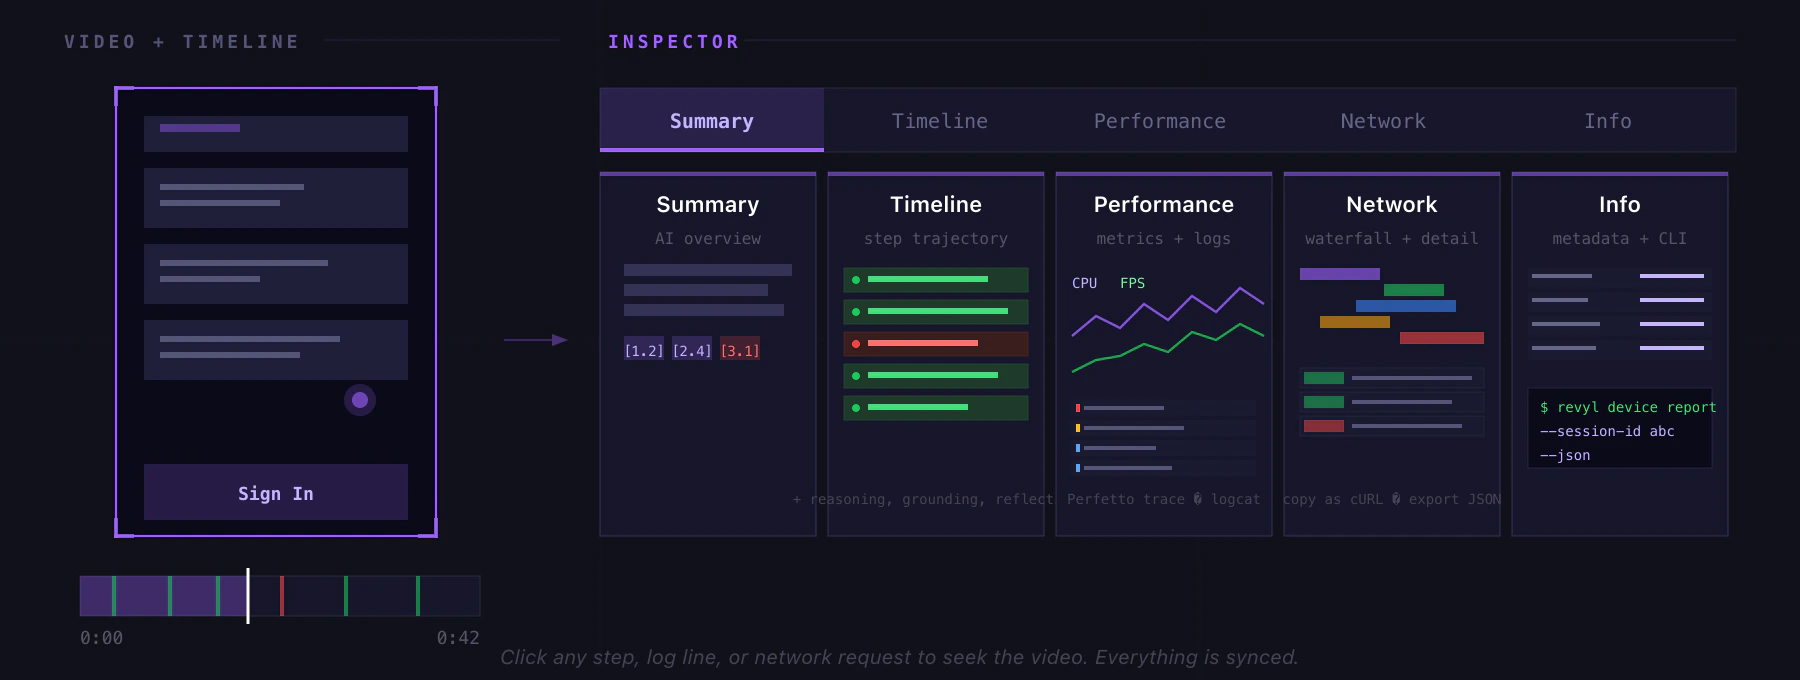
The report has a video player on top (with a scrubbable timeline underneath spanning the full width) and a tabbed inspector on the right. Click any step in the timeline or any log/request to jump the video to that exact moment.Tabs
Summary
An AI-generated overview of the run: what the test was trying to do, plus a numbered list of key moments. Each moment has a clickable reference (like[3.2]) that seeks the video. Failures get a dedicated call-out.
Timeline
The step-by-step agent trajectory. Click any step to see the full details in a focus panel: AI reasoning, timing, grounding screenshot (the bounding-box the agent targeted), reflection feedback, and structured action data (what it tapped, what it typed, etc). Navigate with arrow keys. Use[ and ] to jump between failures.
Performance
Split view with a hardware metrics chart on top and device logs on the bottom. Hardware Metrics - toggle any of these series on the chart:- CPU % - app CPU usage
- FPS - frame rate
- App RSS - resident set size (MB)
- App VSS - virtual size (MB)
- System Mem % - overall device memory pressure
- Filter chips for Error, Warning, Info, Debug (with counts)
- Free-text search across log content
- Click any line to seek the video
- Copy filtered lines to clipboard
- Download the raw log archive
Network
All HTTP and WebSocket traffic from the device, classified and filterable. Top bar: filter by request type (API, Img, Script, Auth, Font, Media, Doc, WS, Other) and search by URL. Waterfall: timeline of requests as colored bars. Drag to zoom a time window, which filters the table below. Request table: every request with status, type, size, duration, and video-relative timestamp. Click a row to:- Seek the video to that request
- Open a detail pane with tabs for Headers, Payload, Preview (images/fonts/media), Timing (DNS/Connect/TLS/TTFB breakdown), and Response
- Copy as cURL to reproduce the request locally
network_requests.json.gz for offline analysis.
Info
Metadata grid with copy-to-clipboard on every value:- Execution Details: timestamp, duration, platform, validations passed
- App Information: app name and build version (clickable, link to the App and Build)
- Device Information: device type, resolution, runtime, platform
- Test Information: test name, test ID, execution ID, trace ID, and test version (open the YAML of blocks as they existed at run time)
- CLI snippets:
revyl device report --session-id <id> --jsonto fetch the report data for scripting
Video Player
Spacebar to play/pause. Click the timeline to scrub. UseF to toggle fullscreen. Press H to cycle playback speed (up to 8x on most browsers, 2x for Android on Safari).
Toggle the action overlay to see taps, swipes, and text input animated on top of the video as they happened.
Sharing
Click Share in the header:- Team link: requires login, sends the recipient straight to the report in-app
- Public link: anyone with the link can view without logging in. Choose expiration: 1 day, 7 days, 30 days, 90 days, or never. Delete or regenerate at any time.
Exports
Keyboard Shortcuts
Accessing Reports
- From Tests, click any test row, then View Runs for historical reports
- From the test editor, click the history icon
- From a workflow run, click into any test result