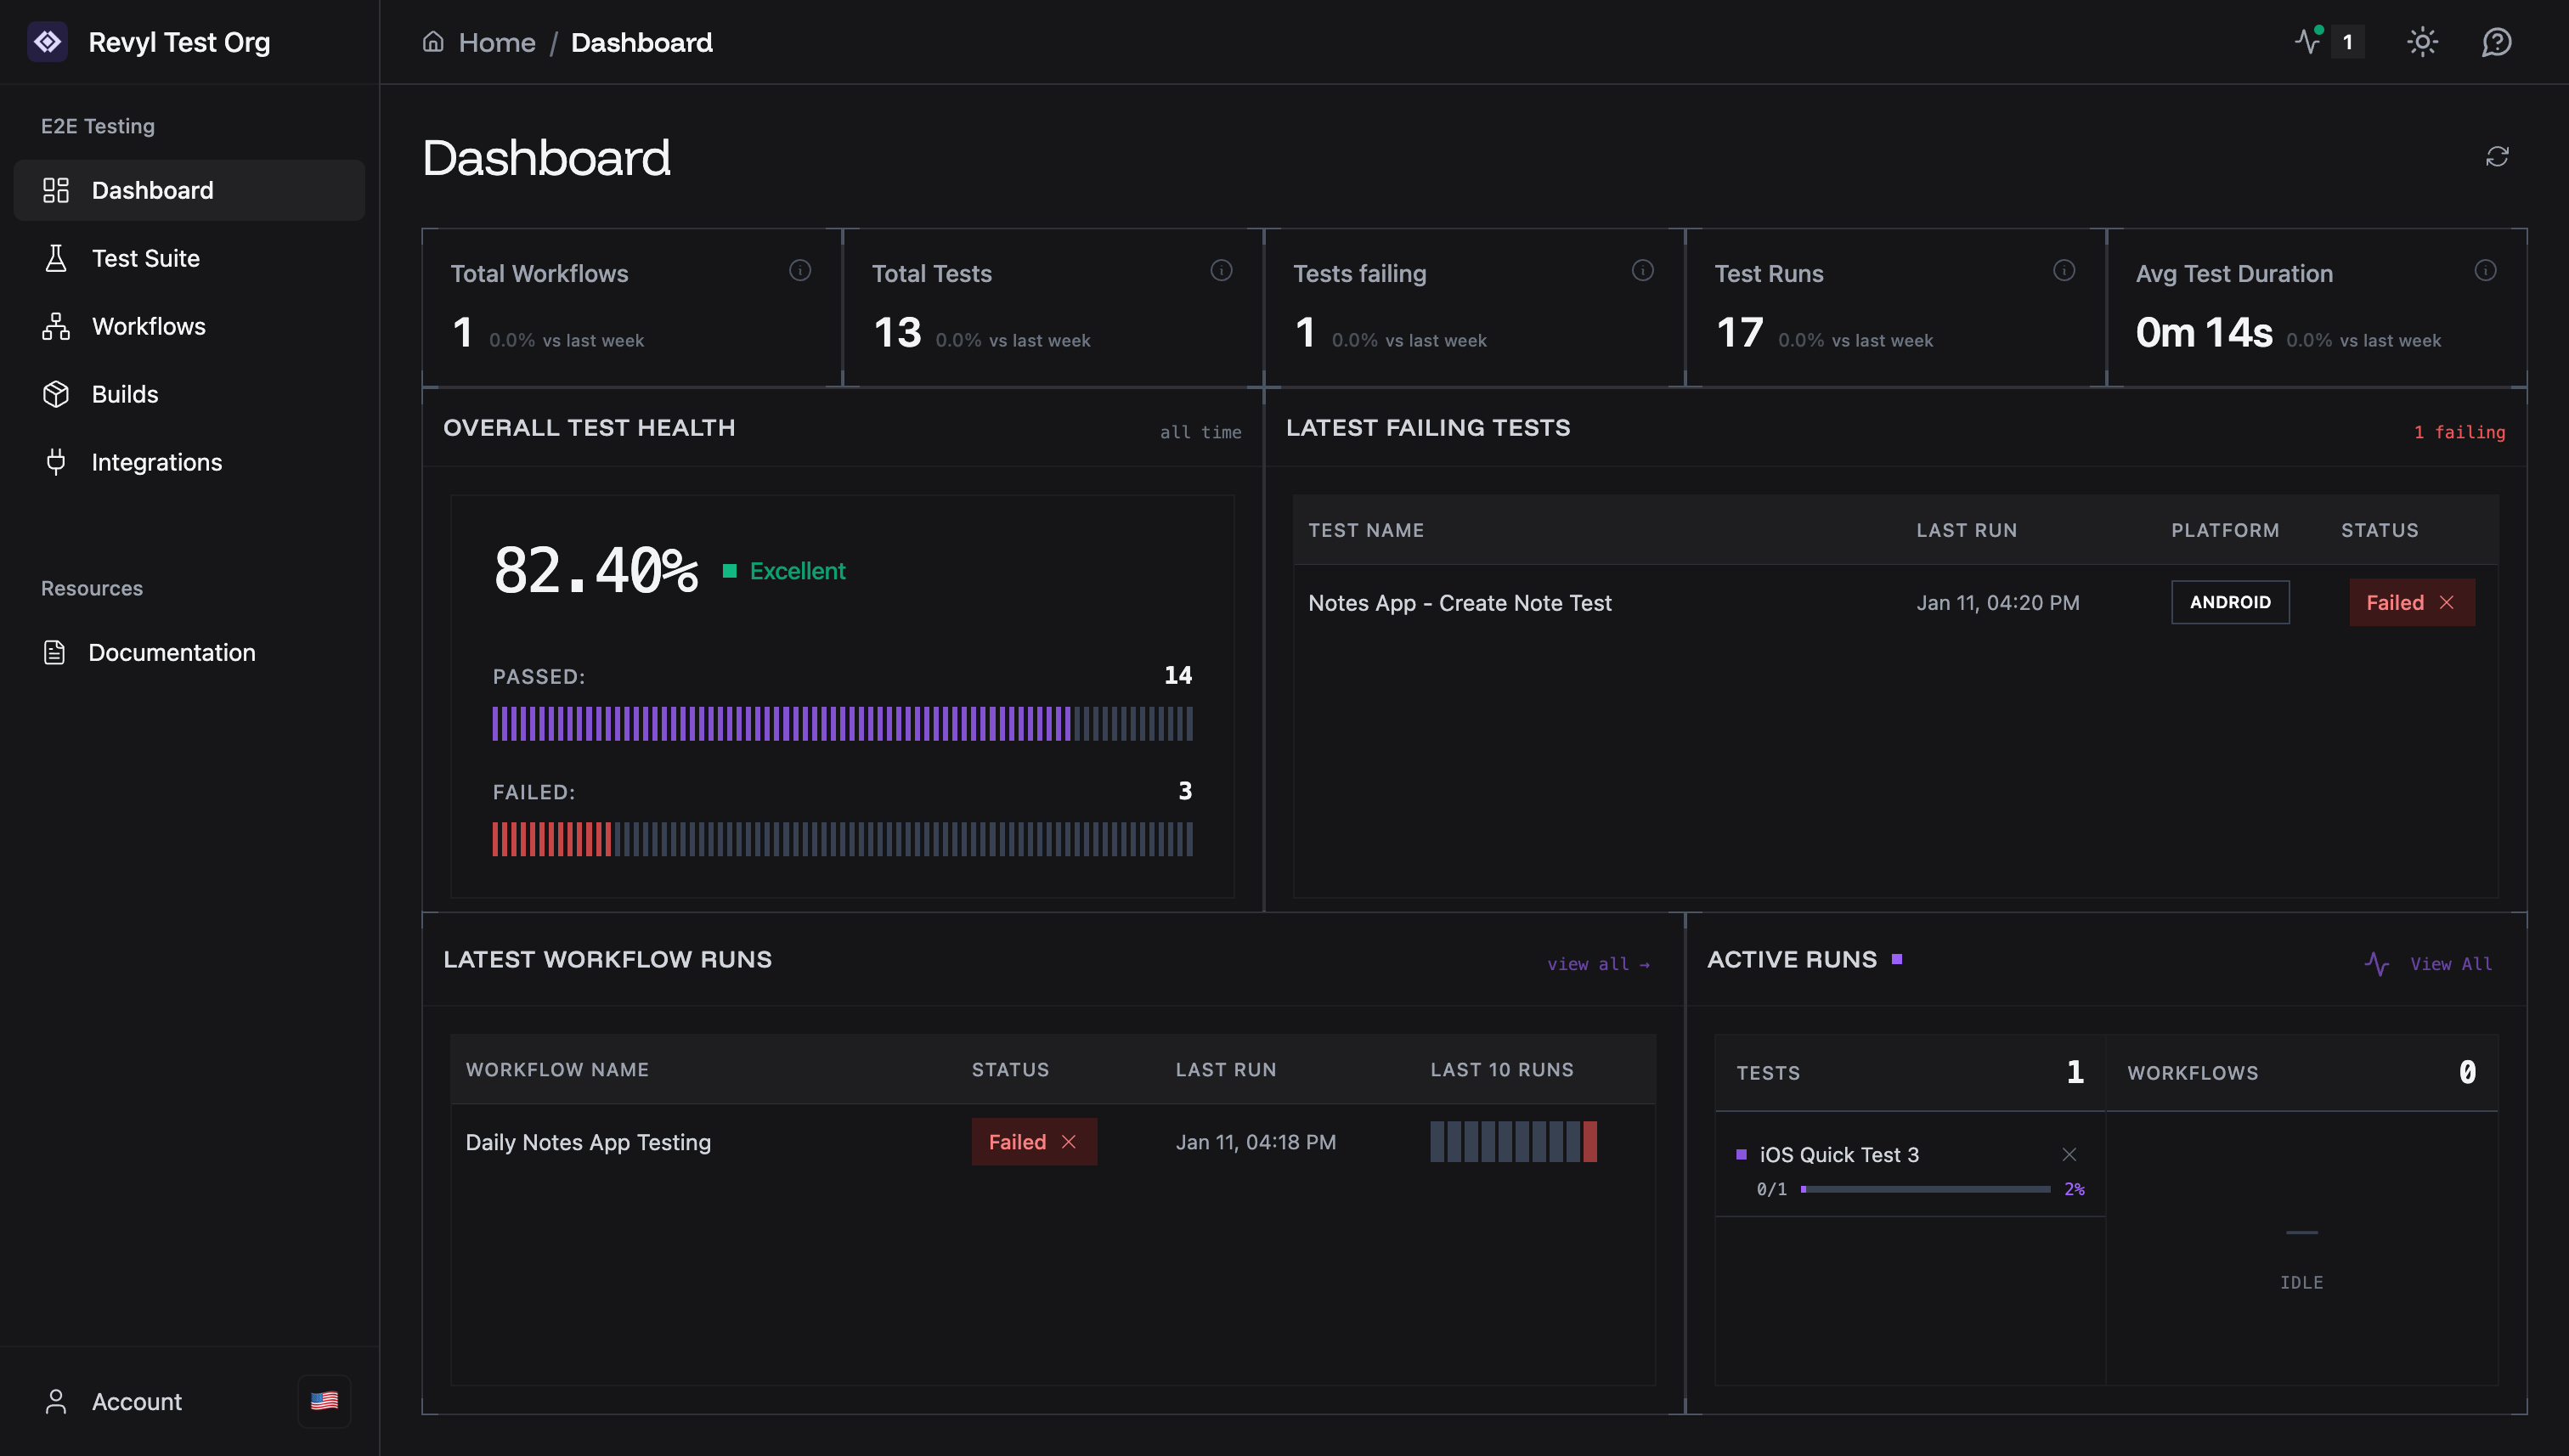
Key Metrics
Track testing activity across your organization.- Total Workflows: All automated workflows
- Total Tests: Number of tests in your suite
- Tests Failing: Currently failing test count
- Test Runs: Total test executions
- Avg Test Duration: Mean execution time
Overall Test Health
Visual pass/fail ratio across all tests.- Pass Rate: Percentage of successful test runs
- Status Indicator: Color-coded health status
- Breakdown: Passed vs Failed counts with history
Latest Failing Tests
Quick access to tests needing attention.- Test Name: Click to view test details
- Last Run: Most recent execution time
- Platform: Android or iOS
- Status: Current test state
Latest Workflow Runs
Recent workflow execution history.- Workflow Name: Click to view workflow details
- Status: Pass, Fail, or Not Run
- Last Run: Most recent execution time
- Last 10 Runs: Visual sparkline of recent runs
Active Runs
Real-time monitor of currently executing tests.- Tests: Number of tests running now
- Workflows: Number of workflows running now
- Status: Idle when nothing is executing
Quick Actions
- Click test/workflow names to open editors
- Use refresh button (top right) to update data
- Access Live Monitor from top navigation bar