Overview
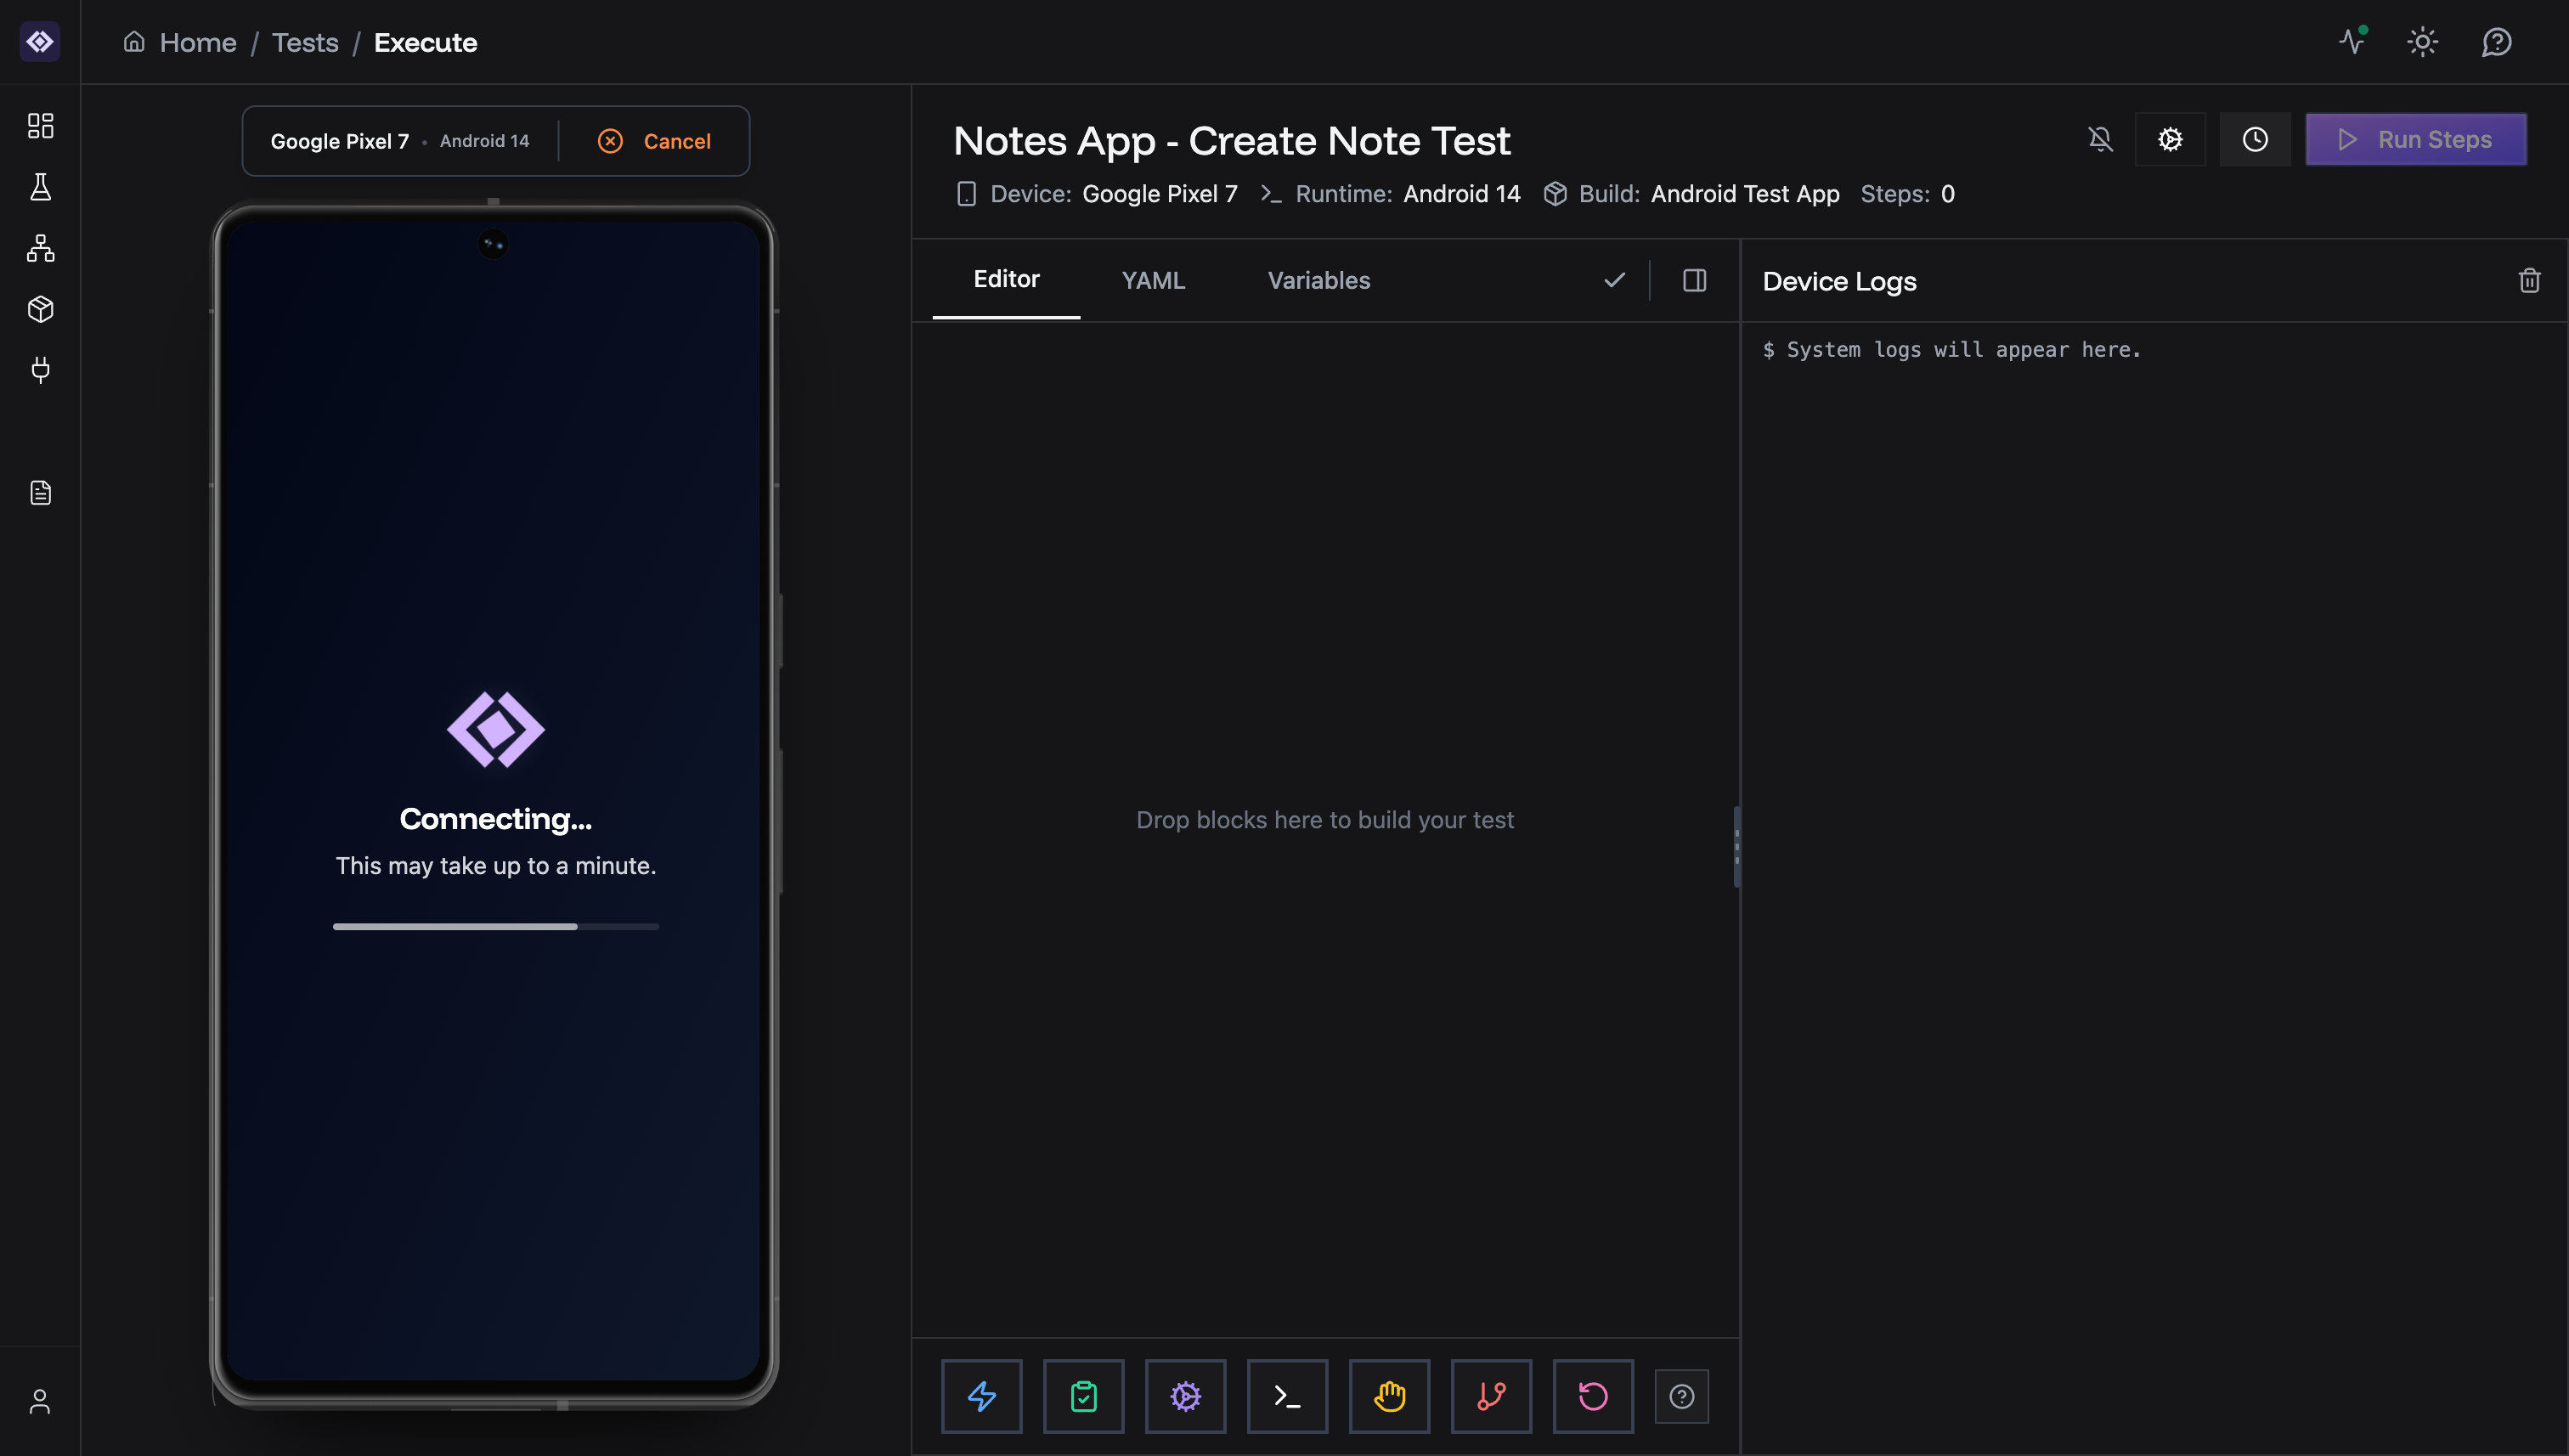
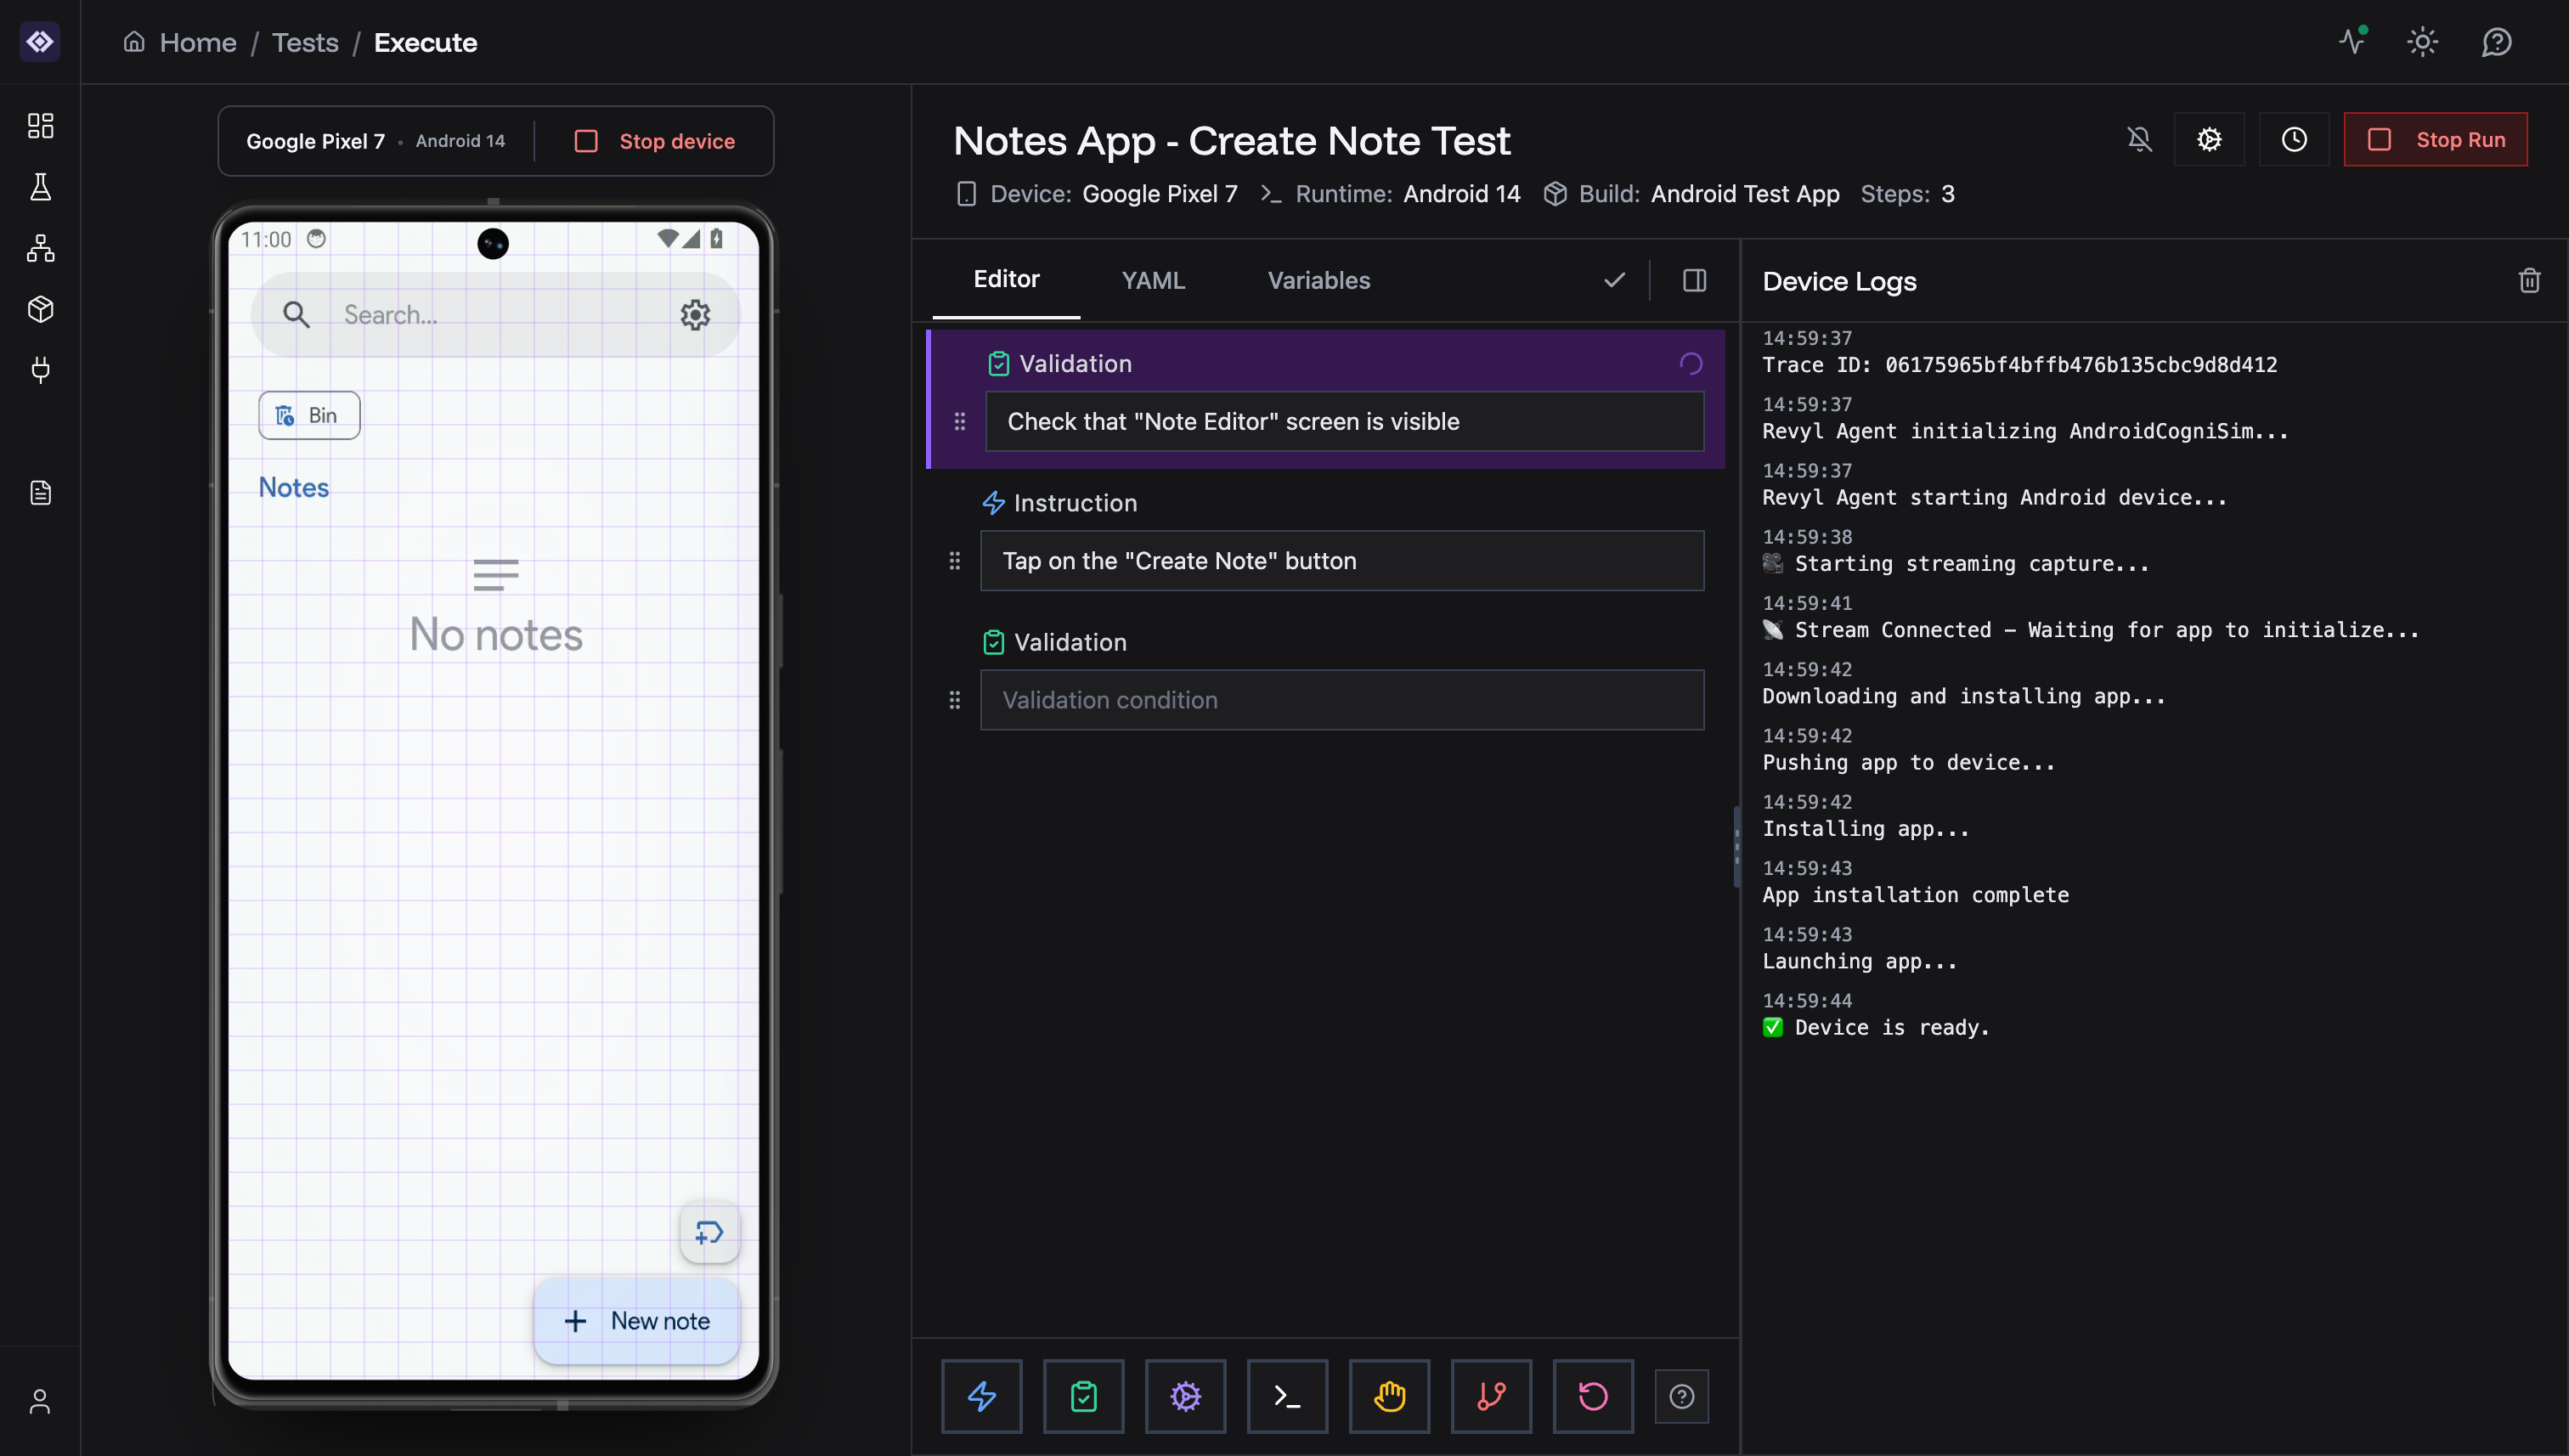
The Test Editor consists of four main areas:- Device Screen (left) - Live view of the device running your test
- Editor Panel (center) - Where you build your test with steps
- Device Logs (bottom right) - Real-time system logs from the device
- Test Controls (top) - Run, save, and configure your test
Opening the Test Editor
To open the Test Editor:- Go to Test Suite in the sidebar
- Click on any test in the list
- Click Open Editor button
Editor Tabs
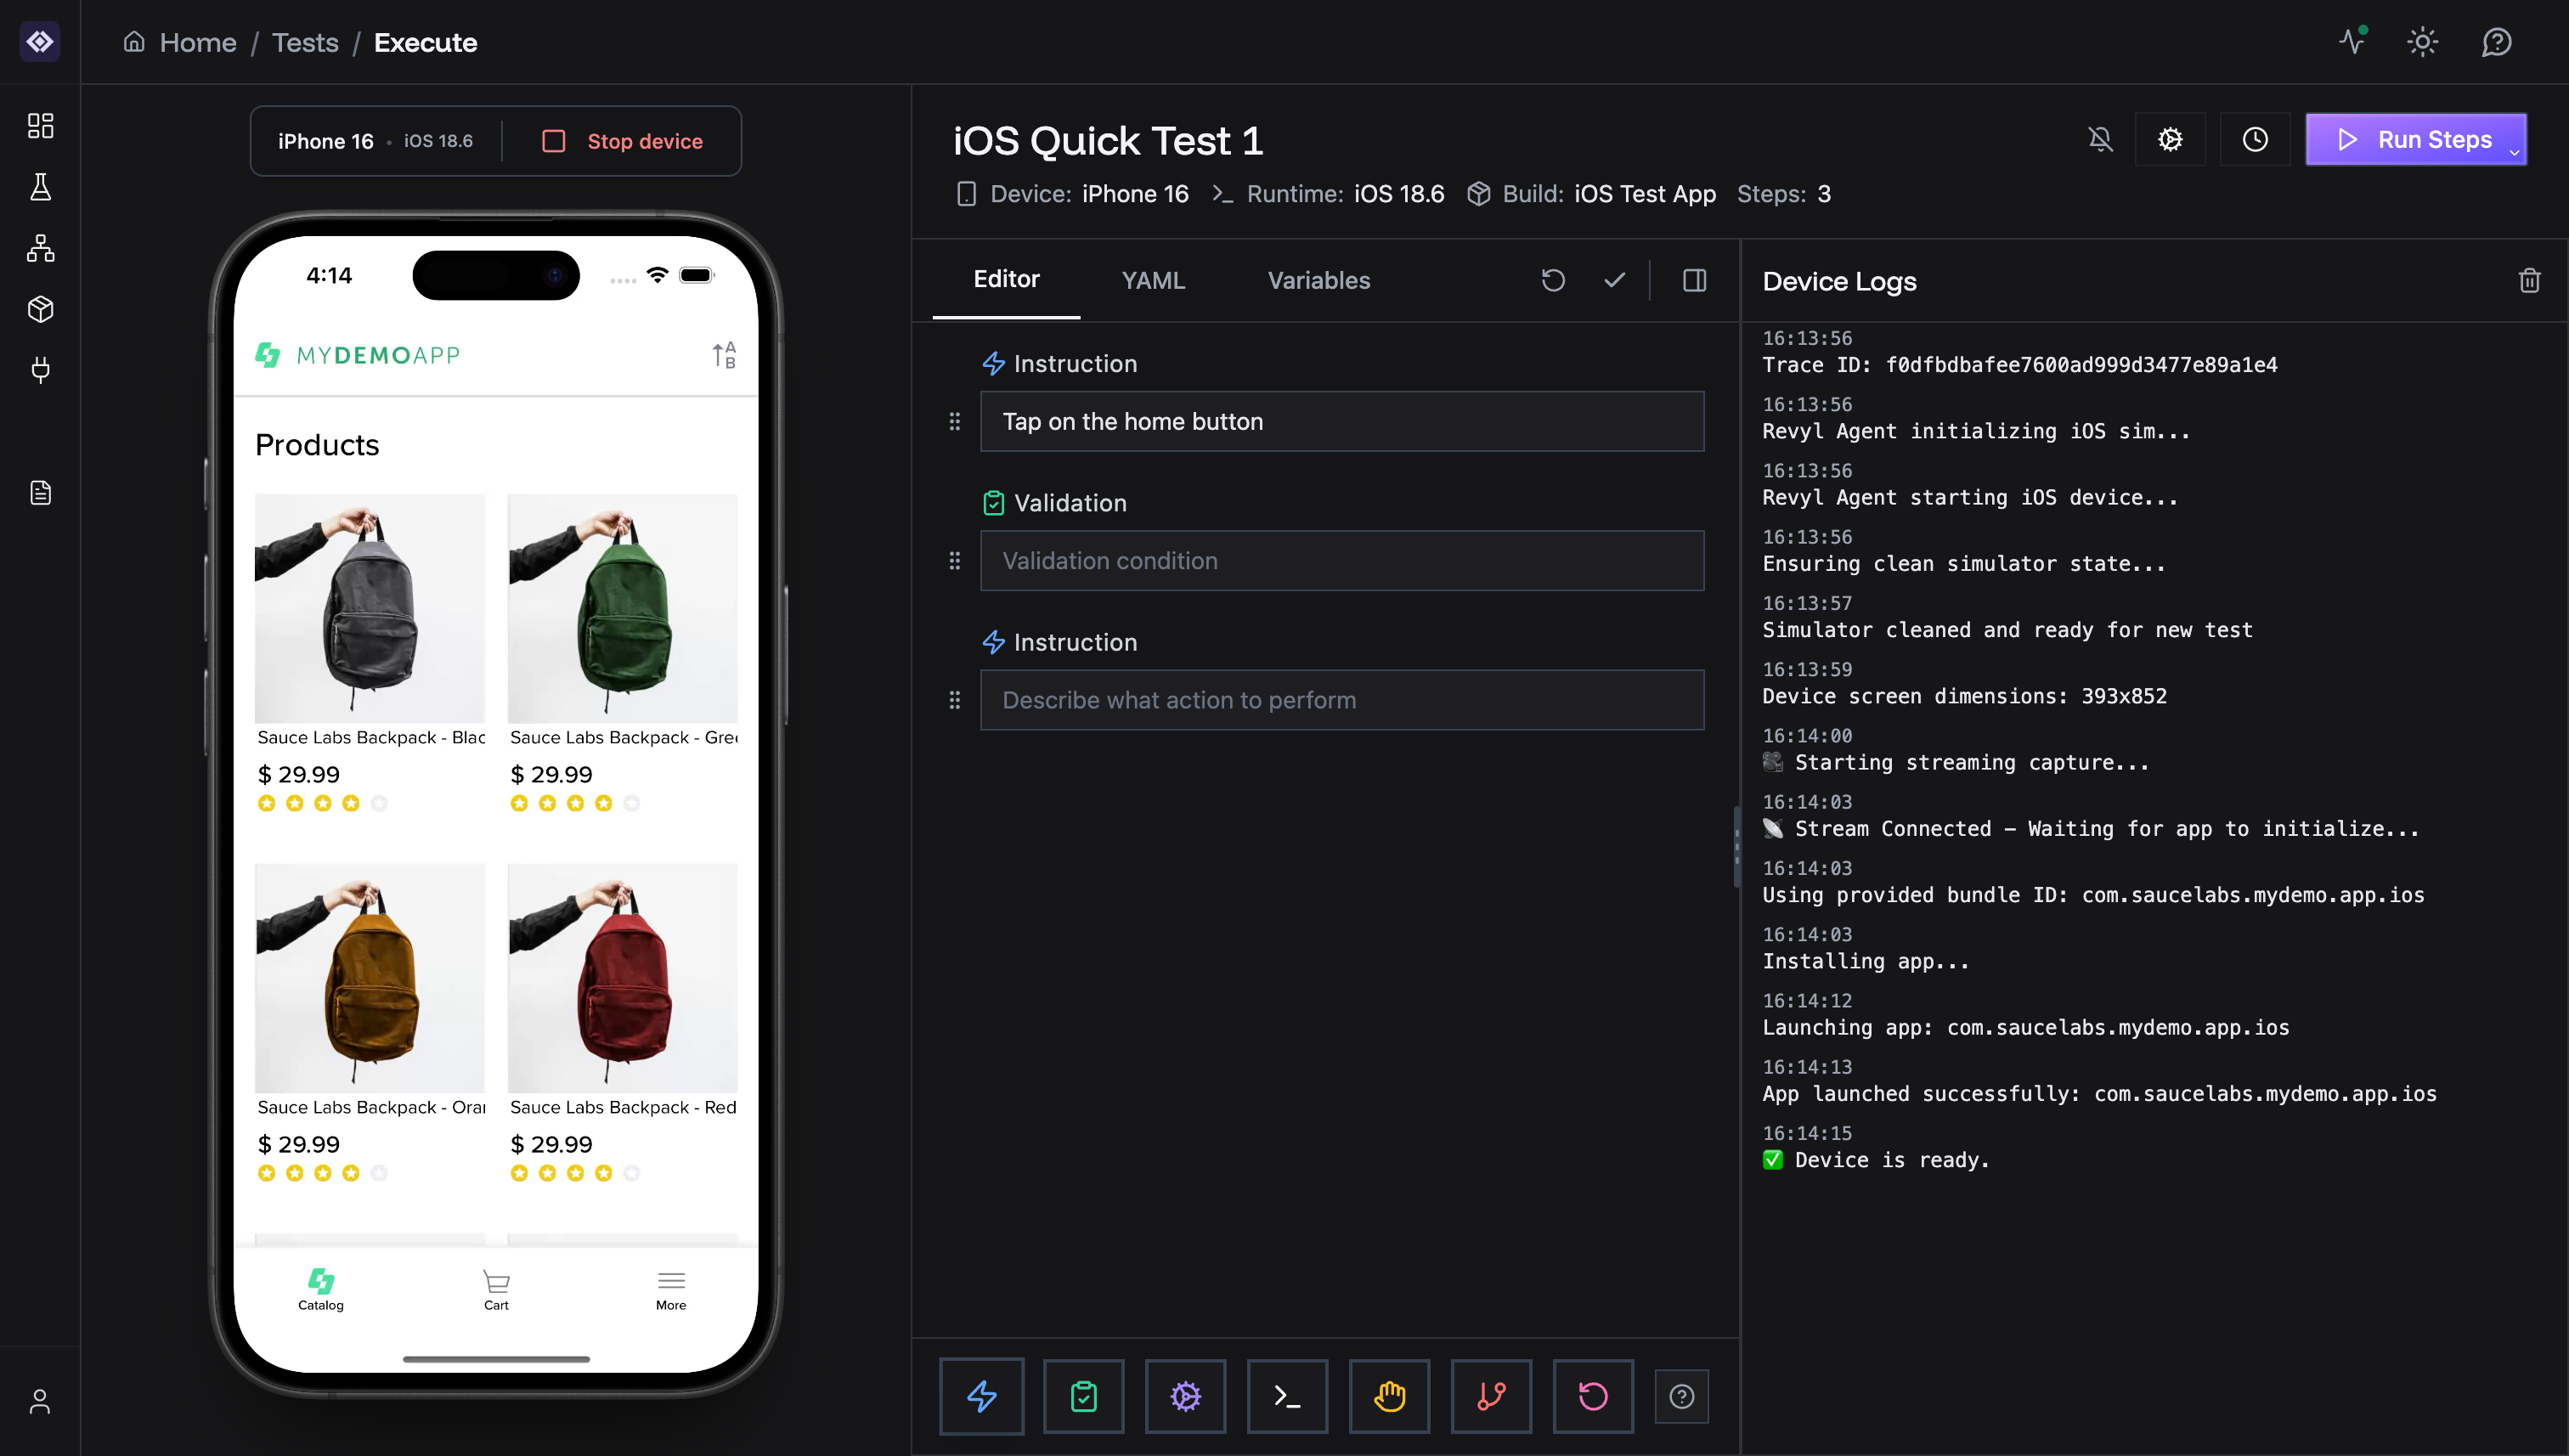
The editor has three tabs:Editor Tab
The visual step builder where you create your test by adding blocks.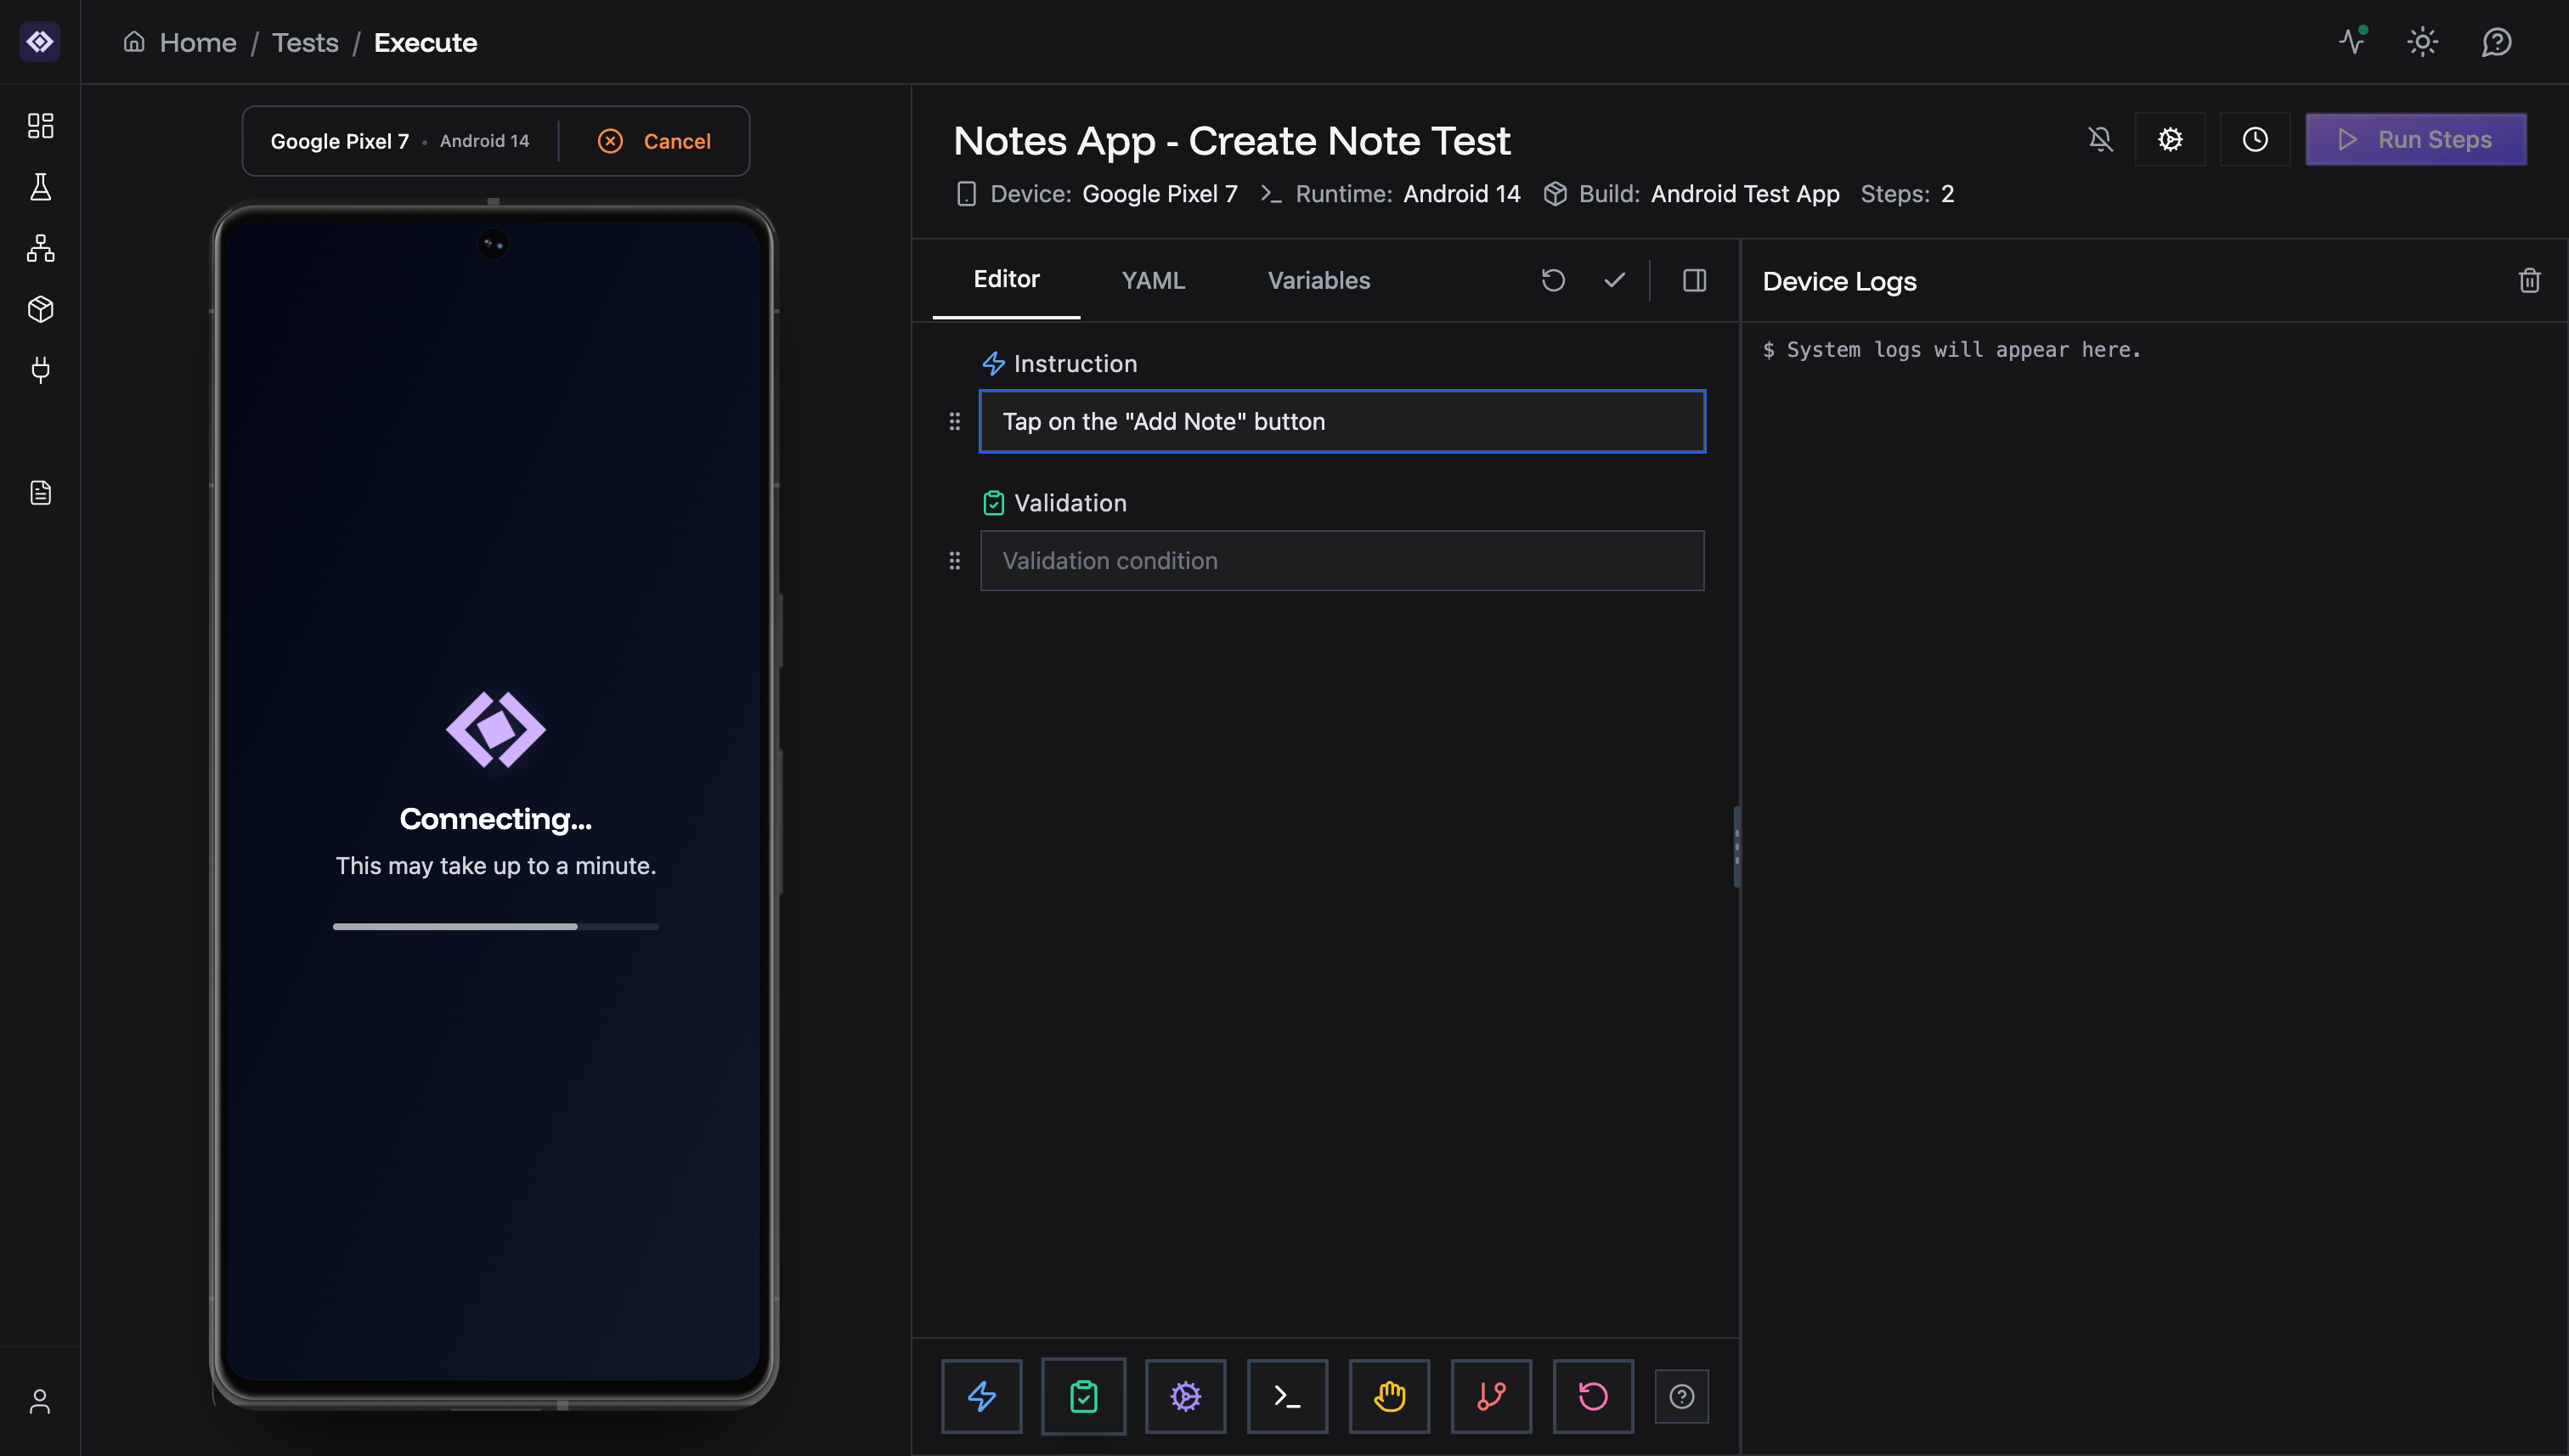
- 🗣️ Instruction - AI-powered actions (tap, type, swipe)
- ☑️ Validation - Check conditions and assertions
- ⚙️ Explicit - Precise click/type actions with selectors
- 💻 Script - Custom code execution
- ✋ Manual - Wait, open/close app, go home, set location, open deep links
- 🔁 Loop - Repeat actions multiple times
- 🔀 Decision - Conditional branching
- ❓ Help - Documentation and examples
YAML Tab
View and edit the YAML representation of your test. You can export this for CI/CD integration.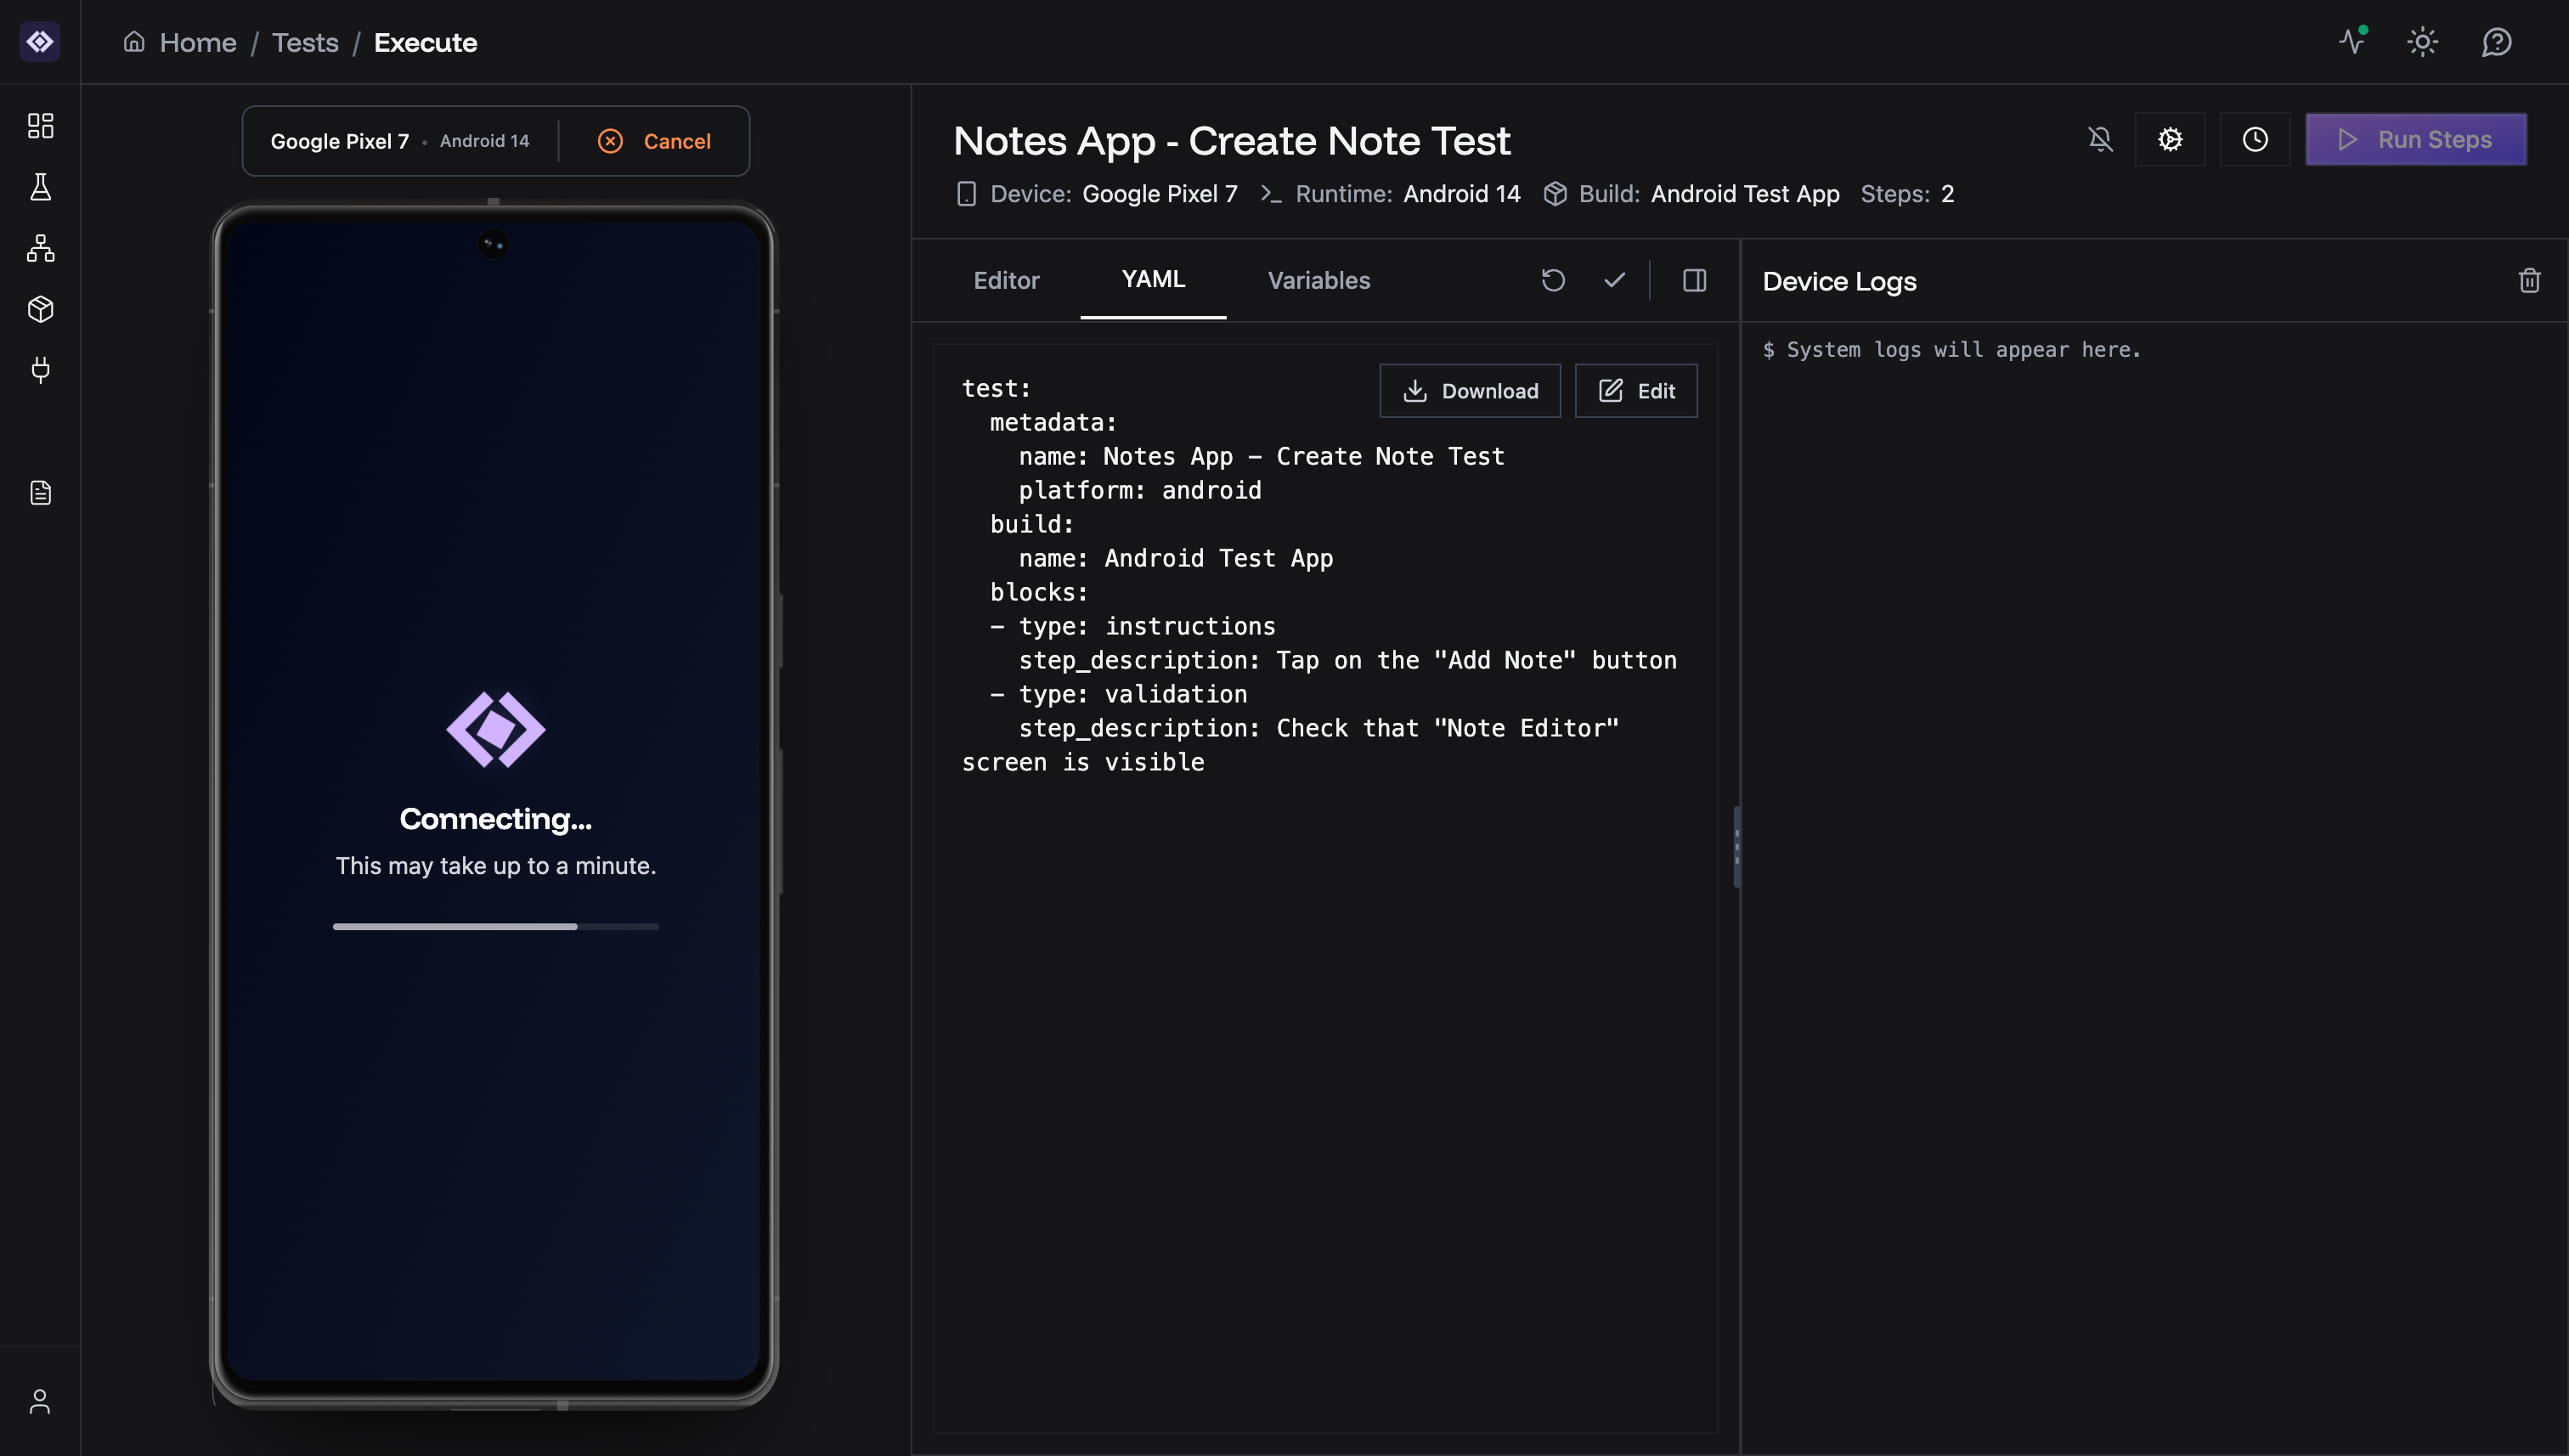
- Download - Save YAML file locally
- Edit - Manually edit the YAML (advanced)
Variables Tab
Create and manage test variables for dynamic data.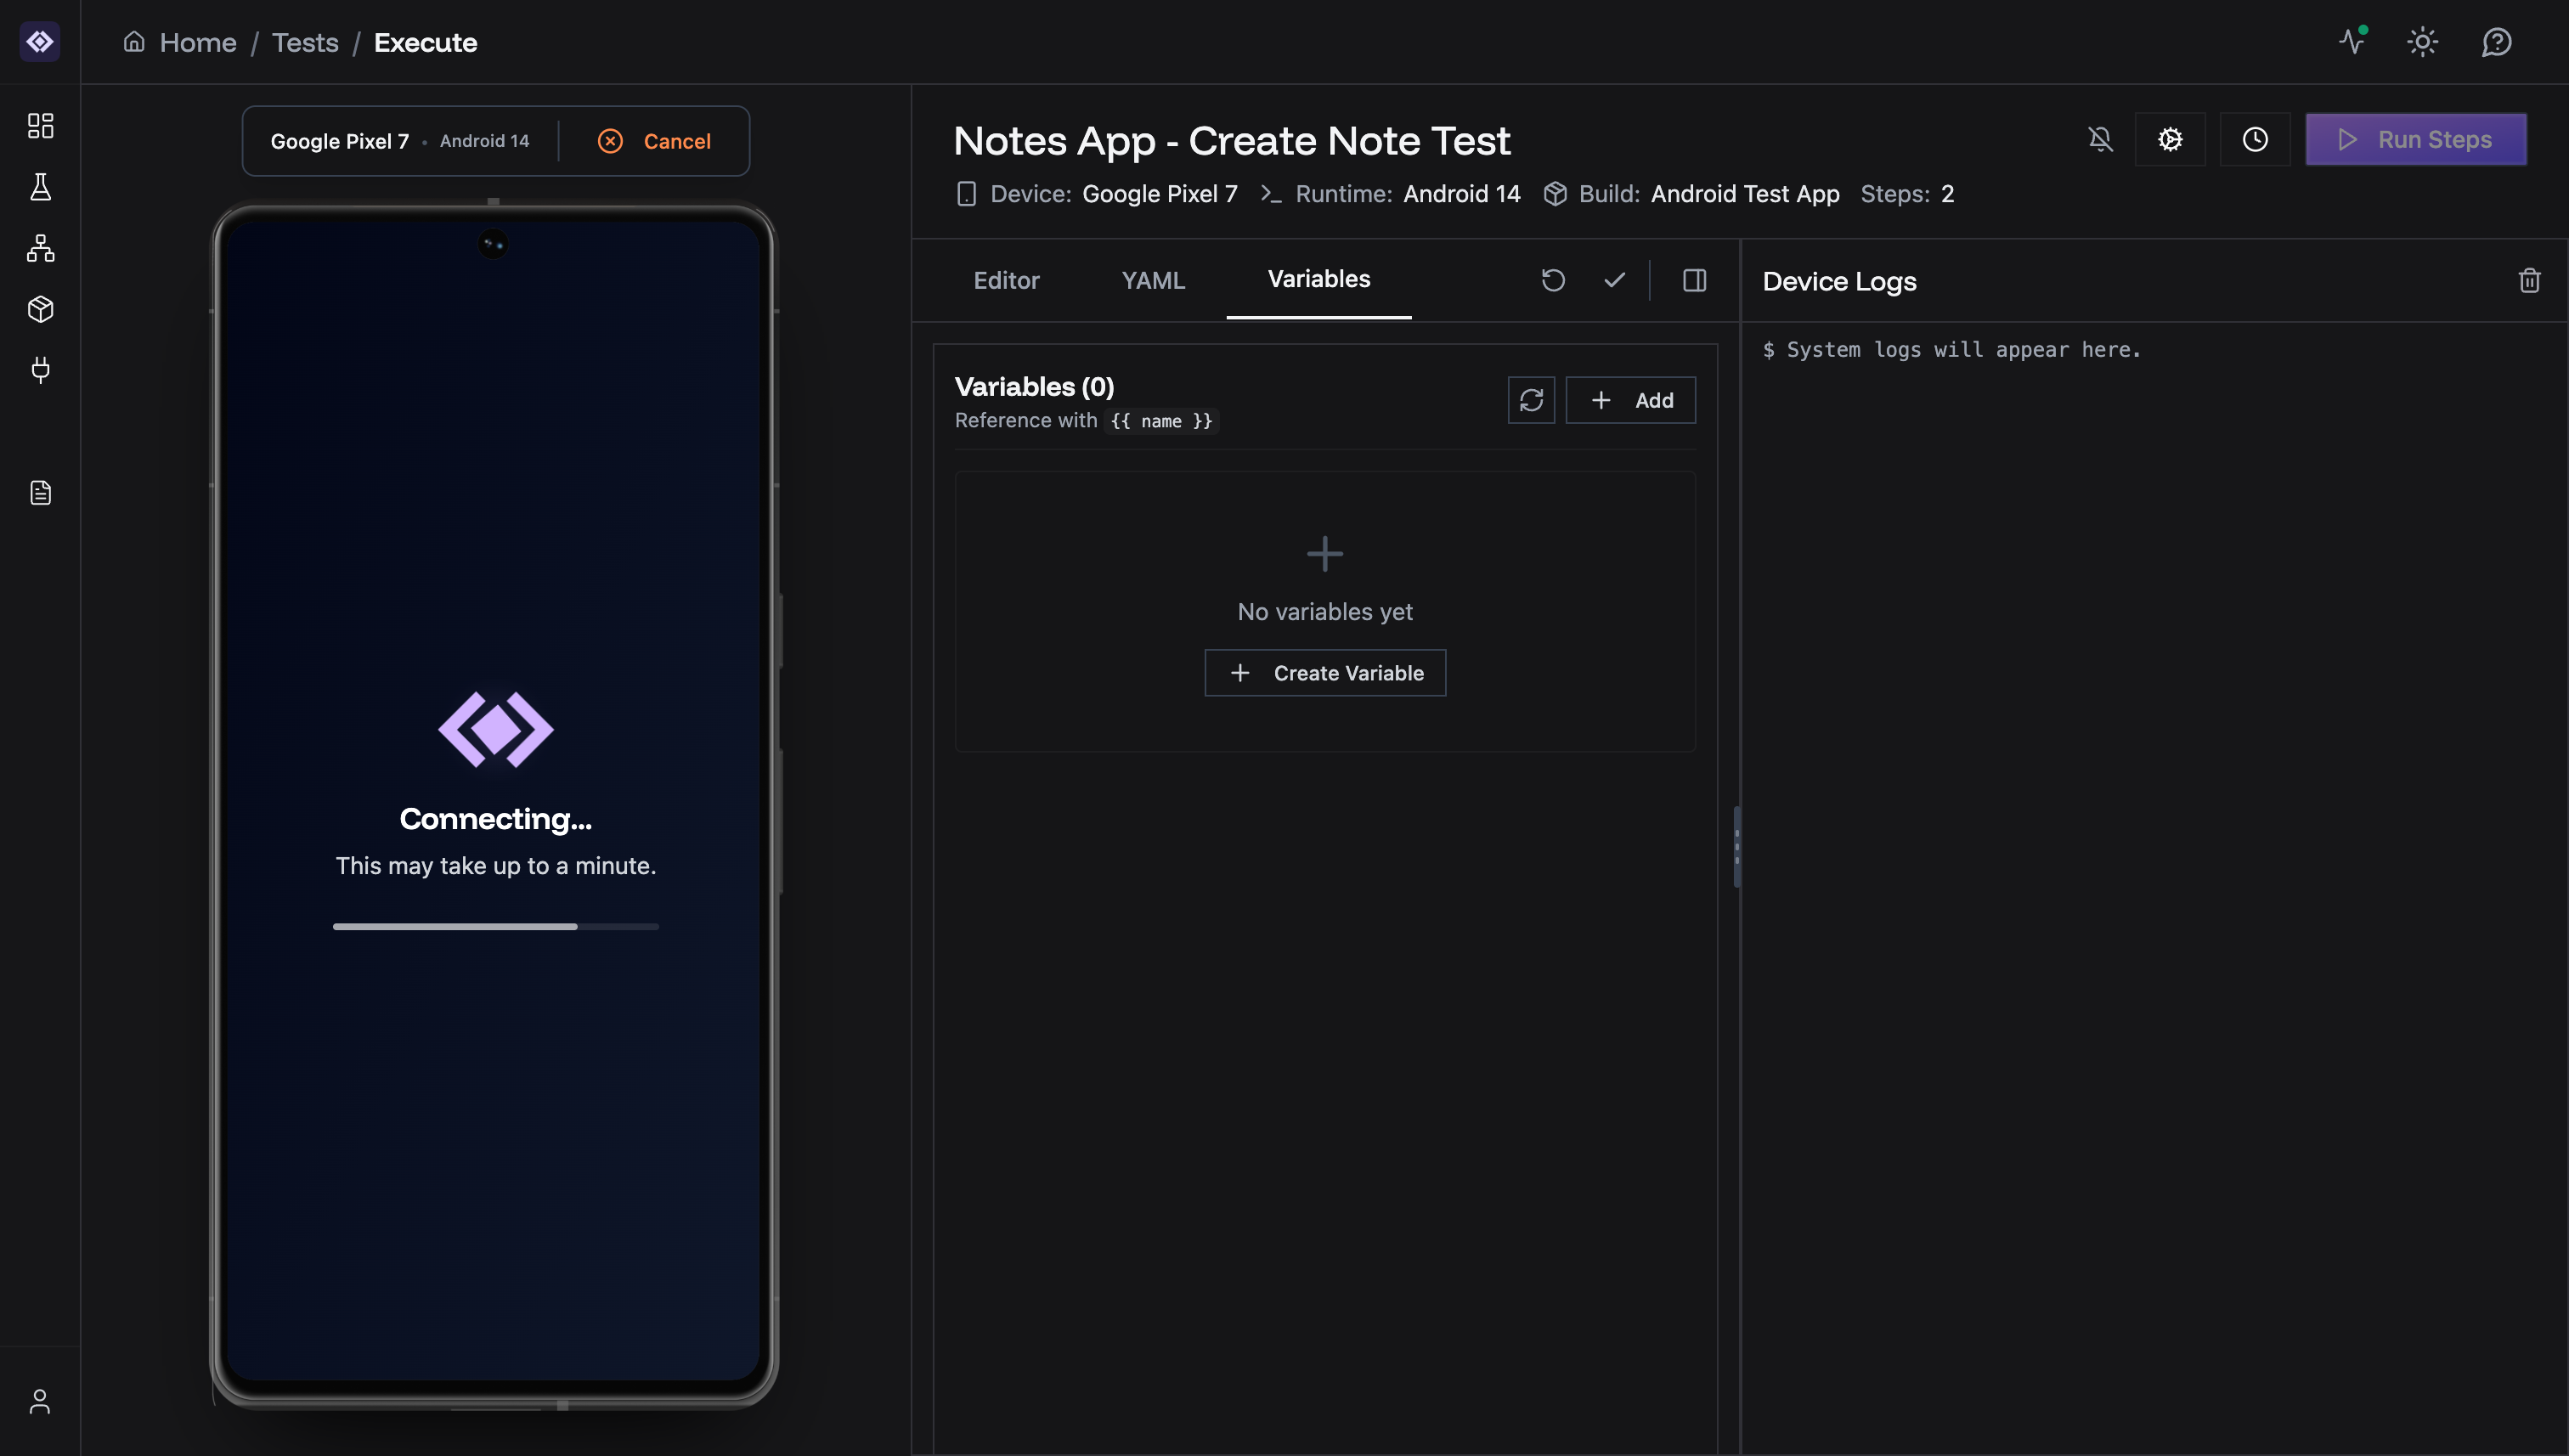
{{ variable_name }} syntax.
Adding Steps
To add a step:- Click or drag in any step type button at the bottom of the editor
- The step is added to your test sequence
- Fill in the step description or configuration
Step Interactions
- ▶ Run - Execute this single step on the device
- 📋 Duplicate - Copy the step with all settings
- 🗑️ Delete - Remove the step from the test
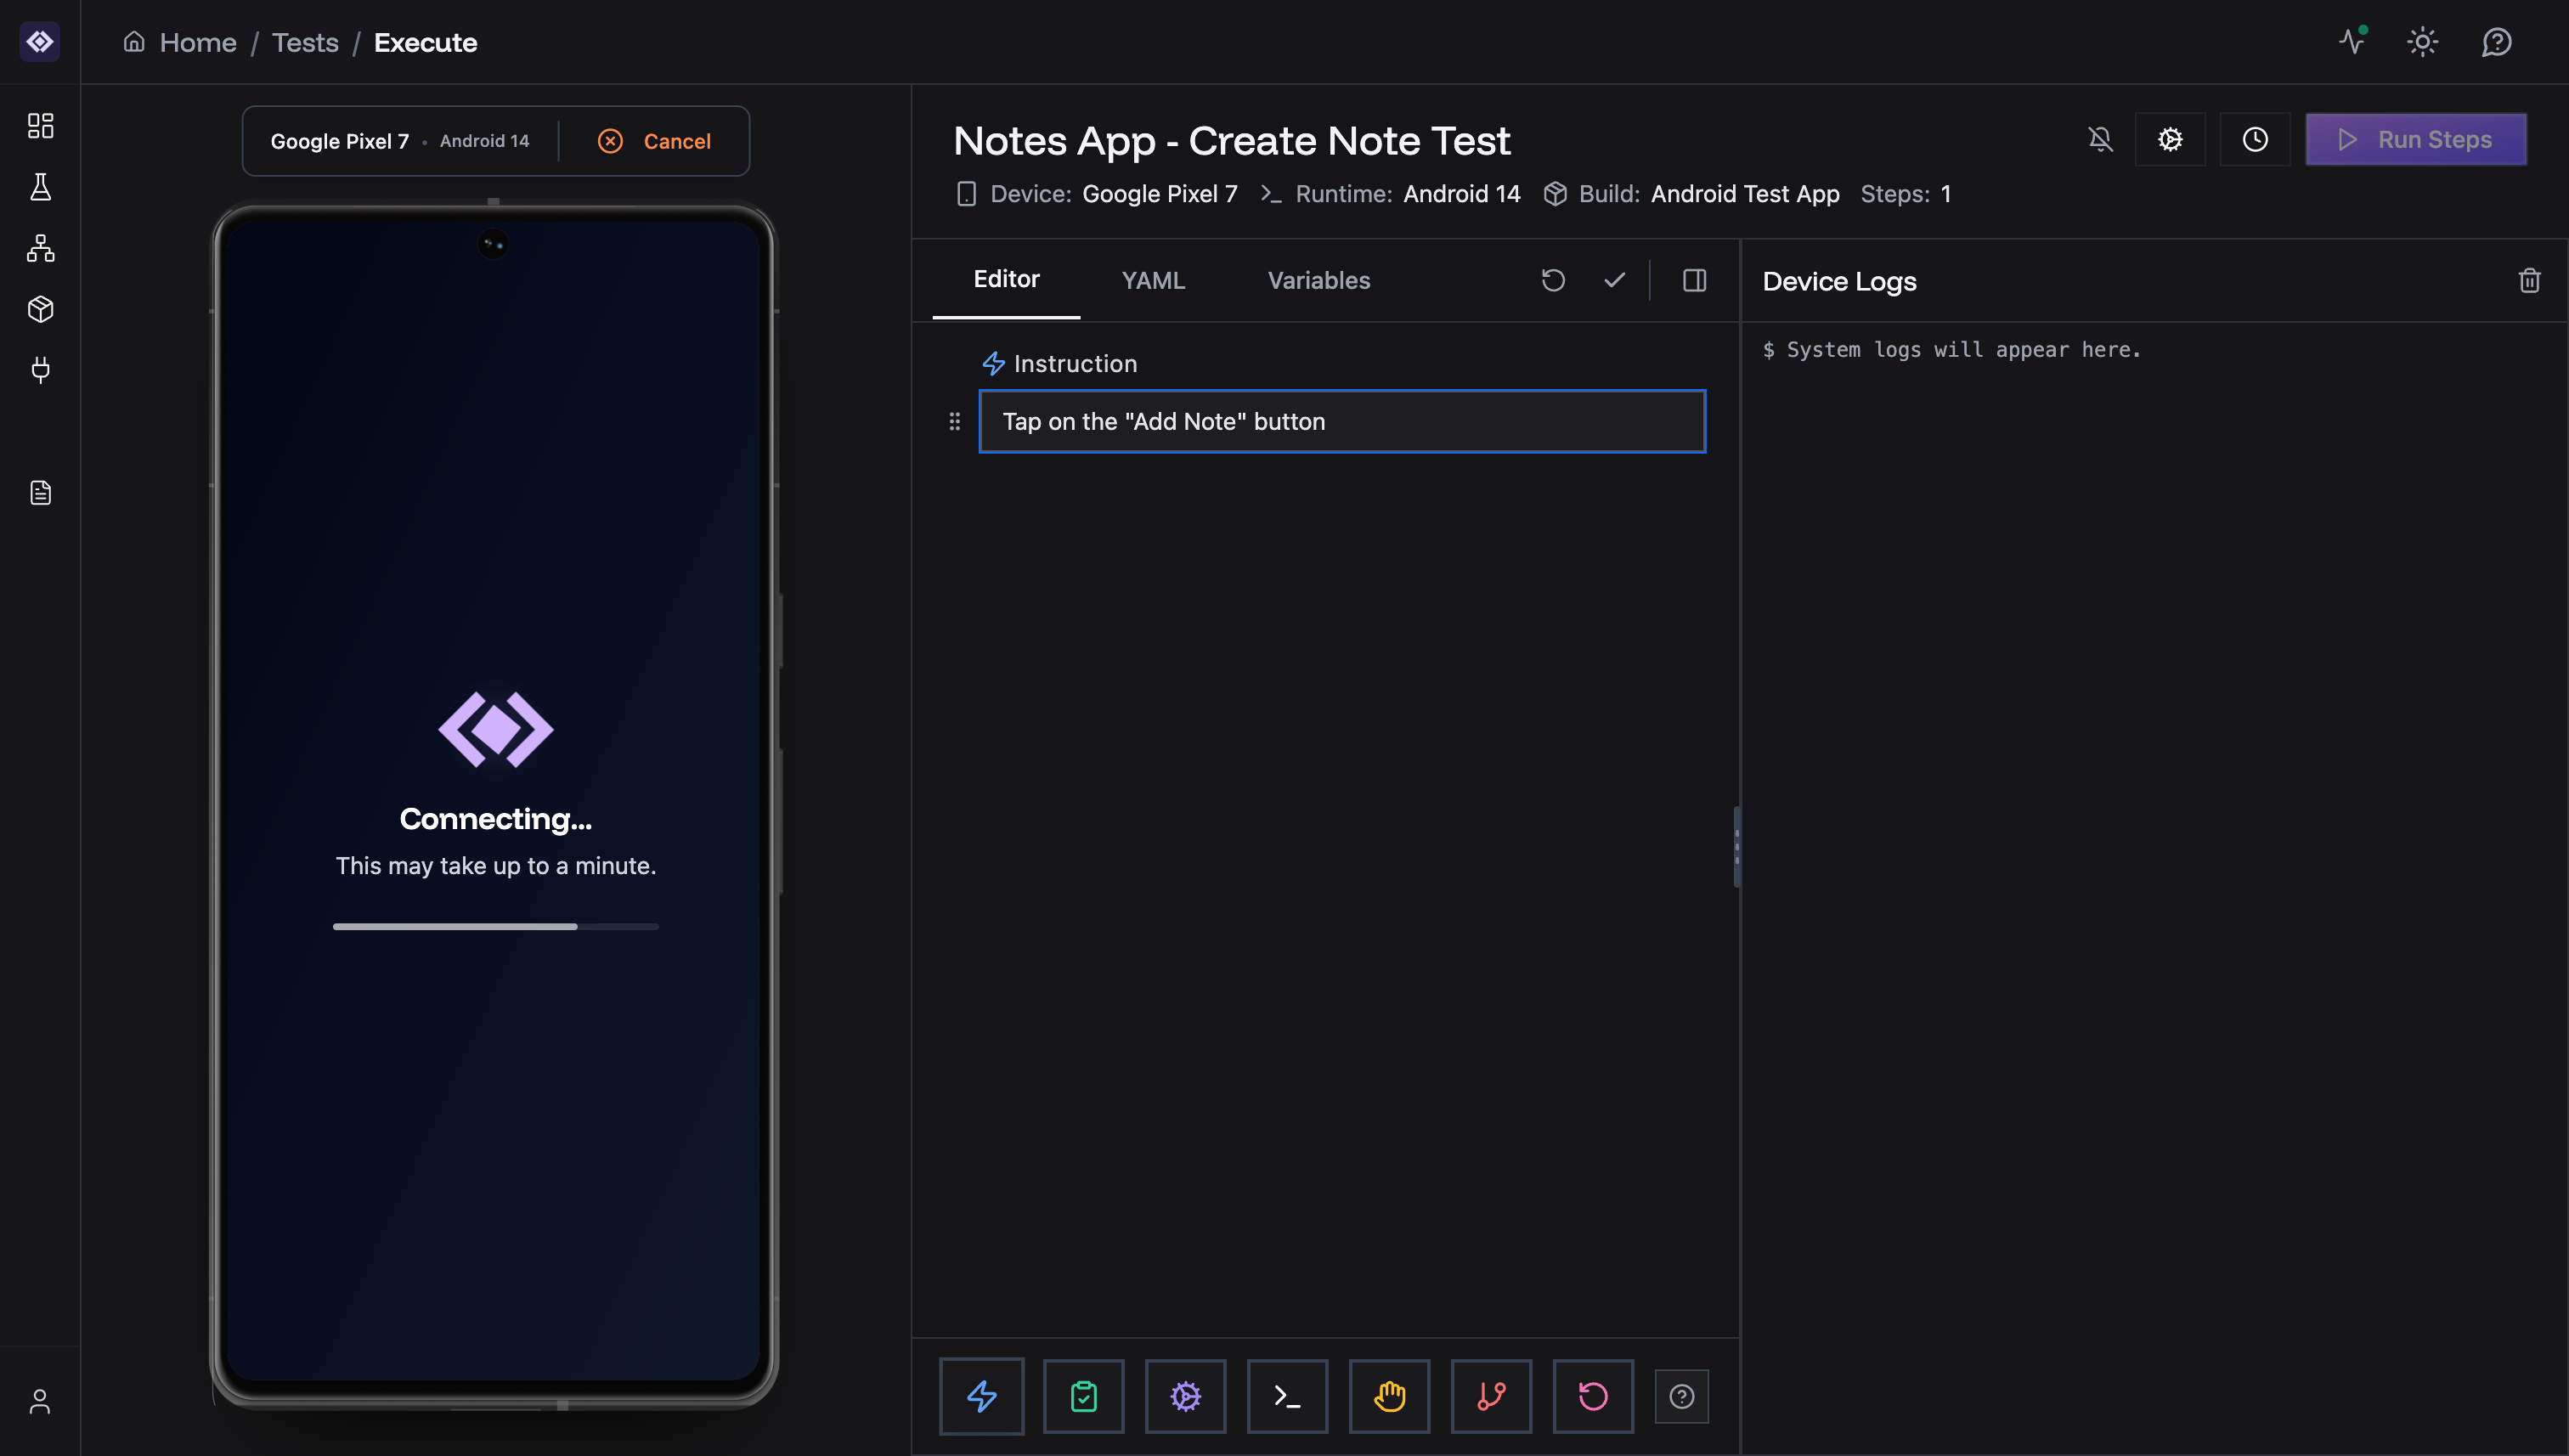
Device Connection
When you open the Test Editor, a device automatically starts connecting:- Connecting… - Device is booting (iOS: 5-30 seconds, Android: 5-45 seconds — varies by app size)
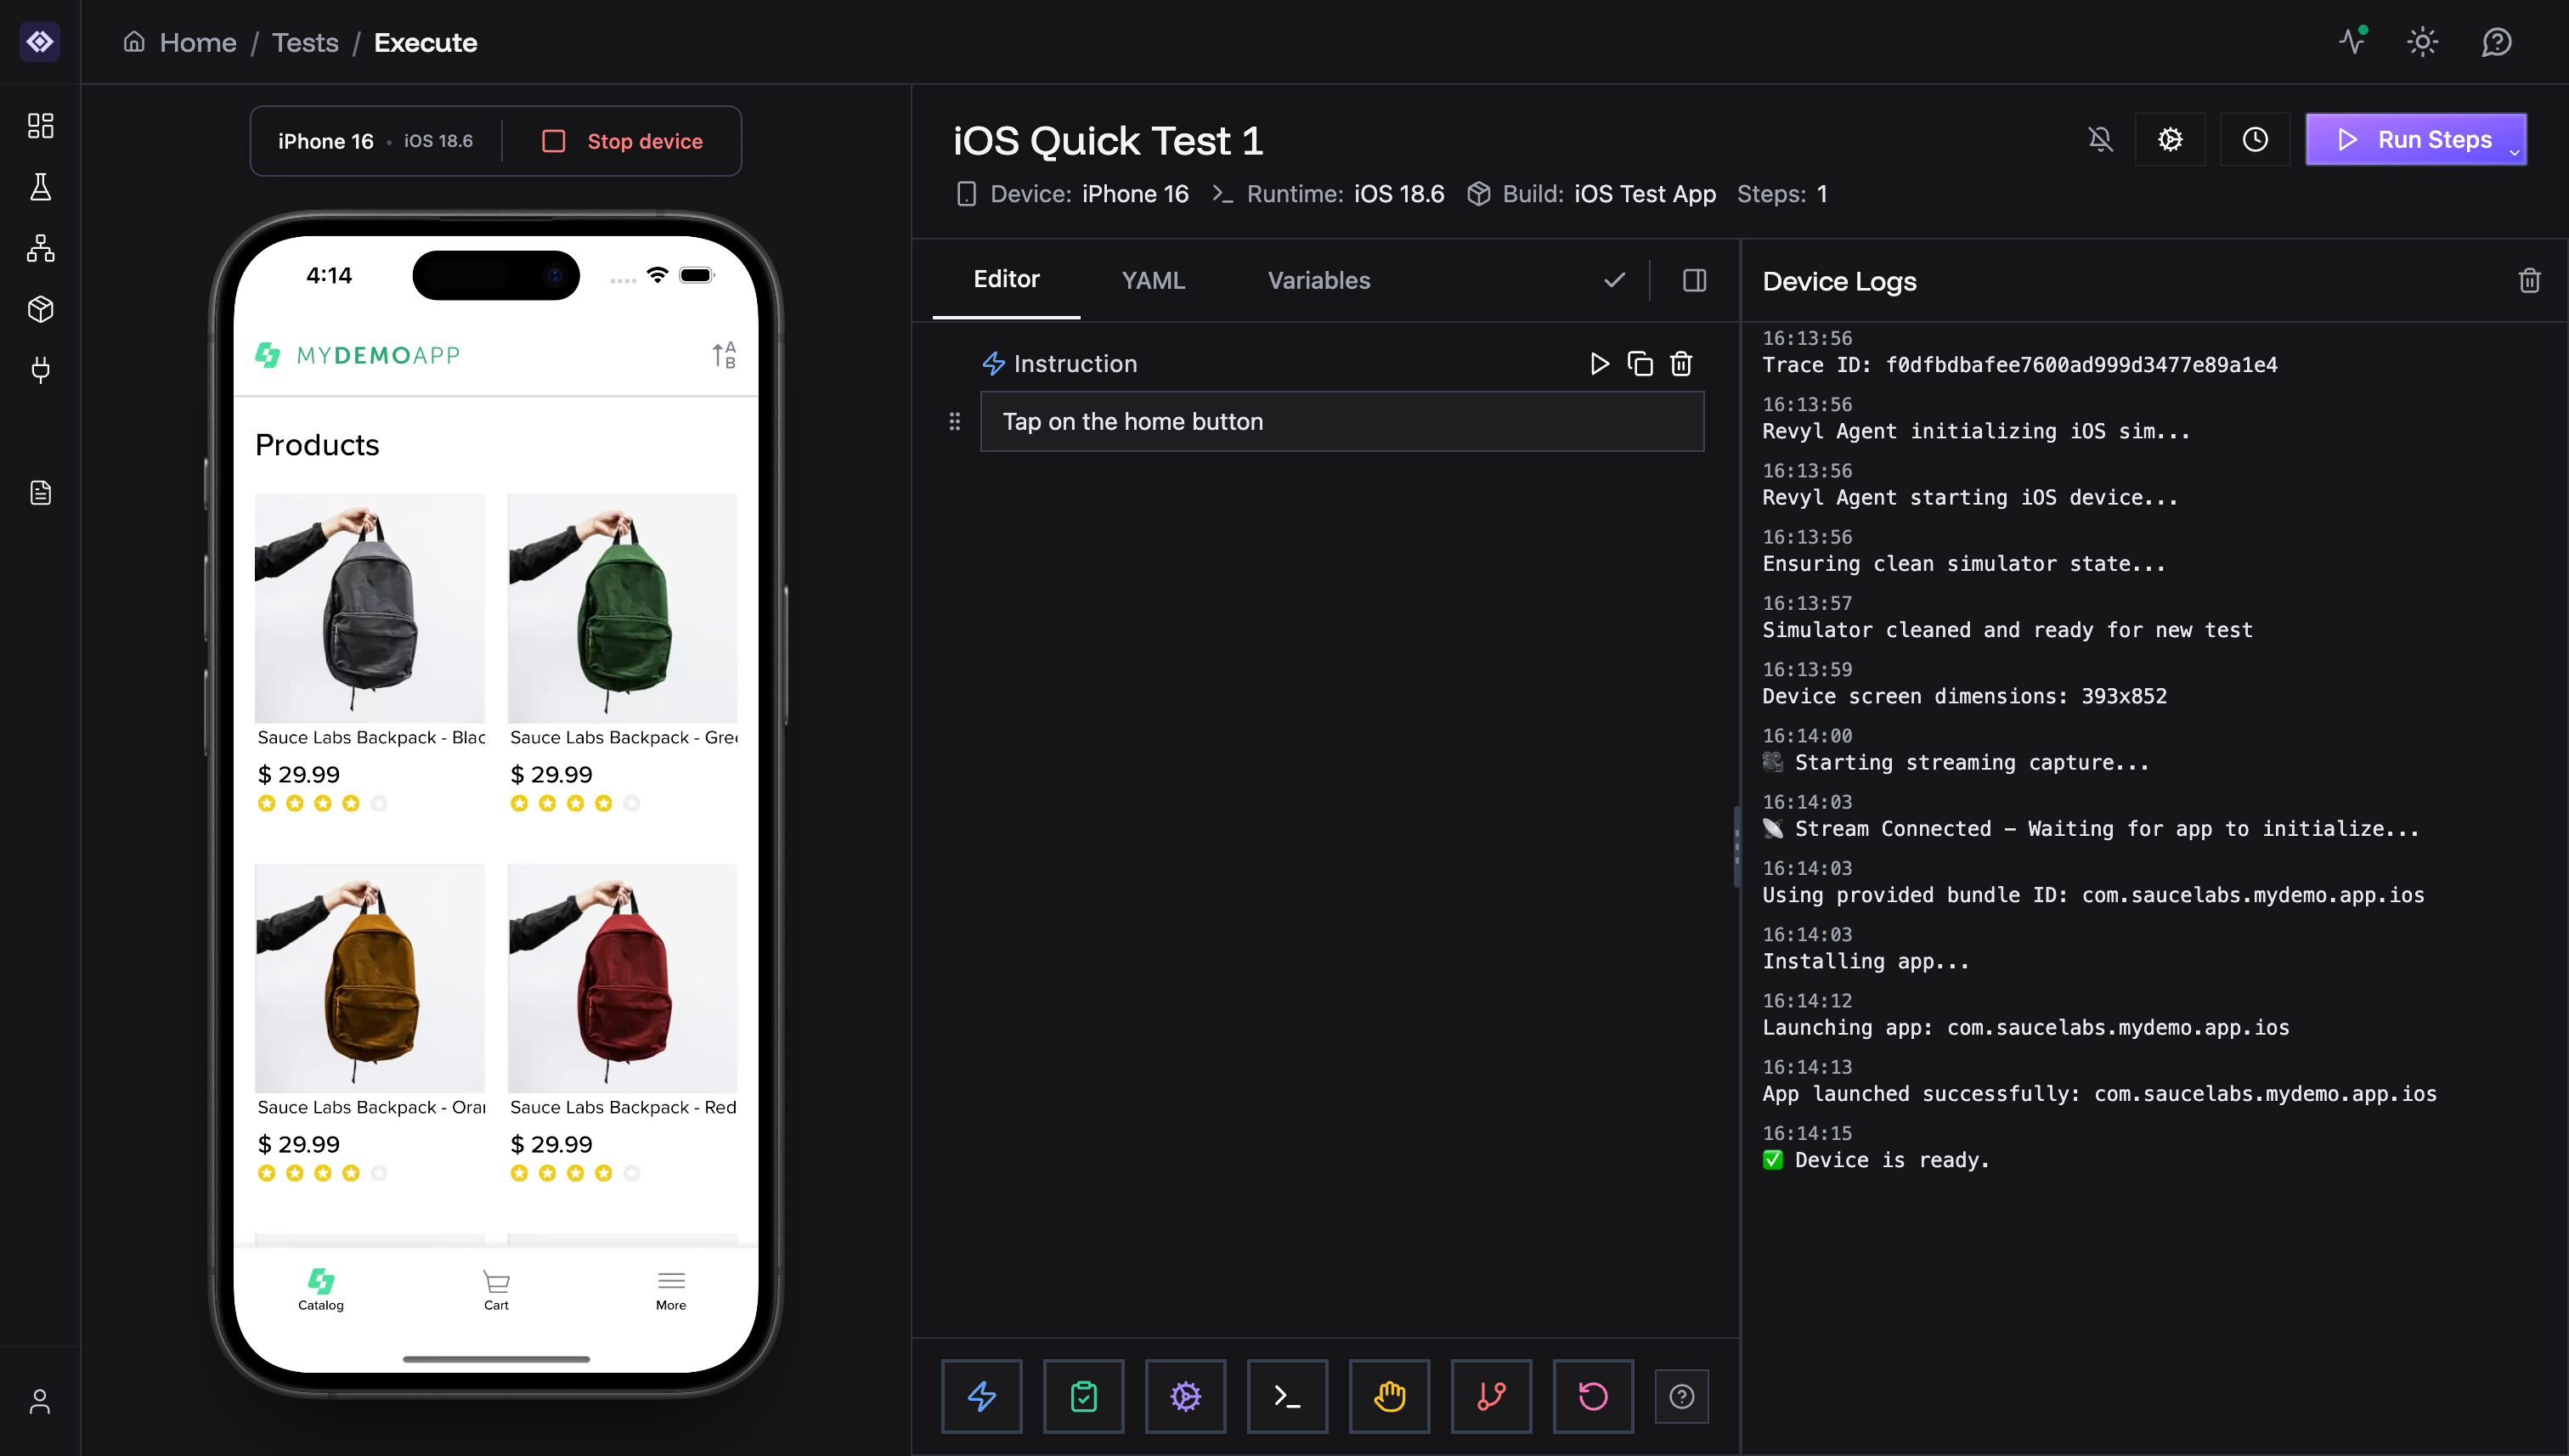
- Connected - Device is ready, live screen visible
- Running - Test or test steps executing on the device
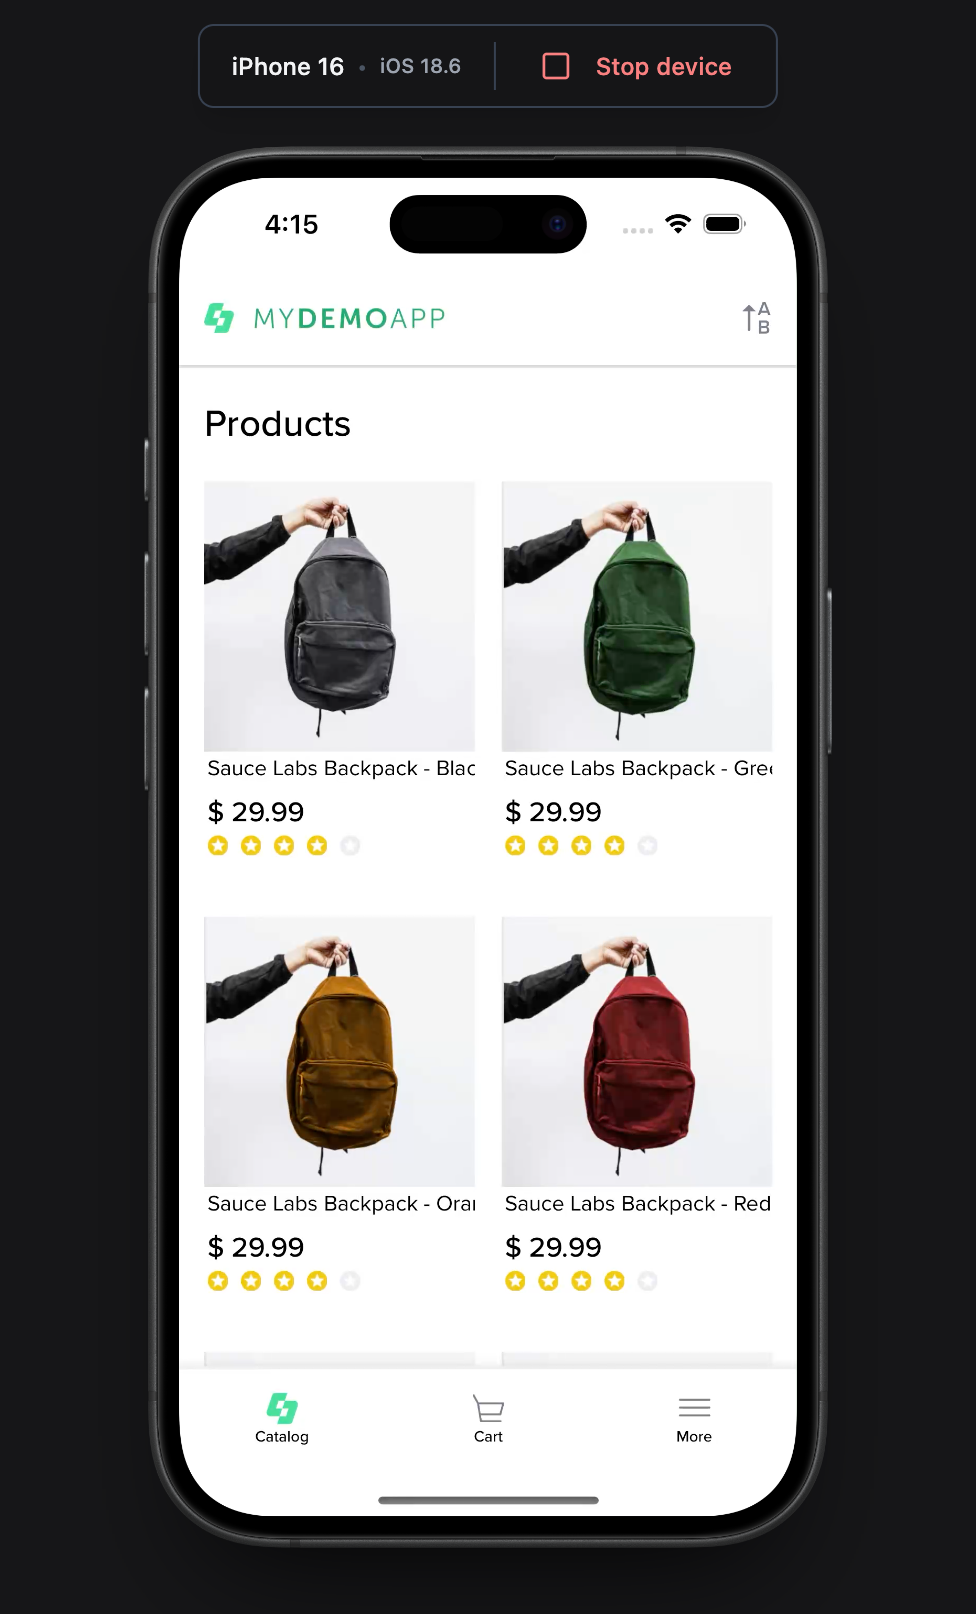
- Shows device model and OS version at the top
- Stop device button (red) - Disconnect the device when done
- Live device screen updates in real-time during test execution
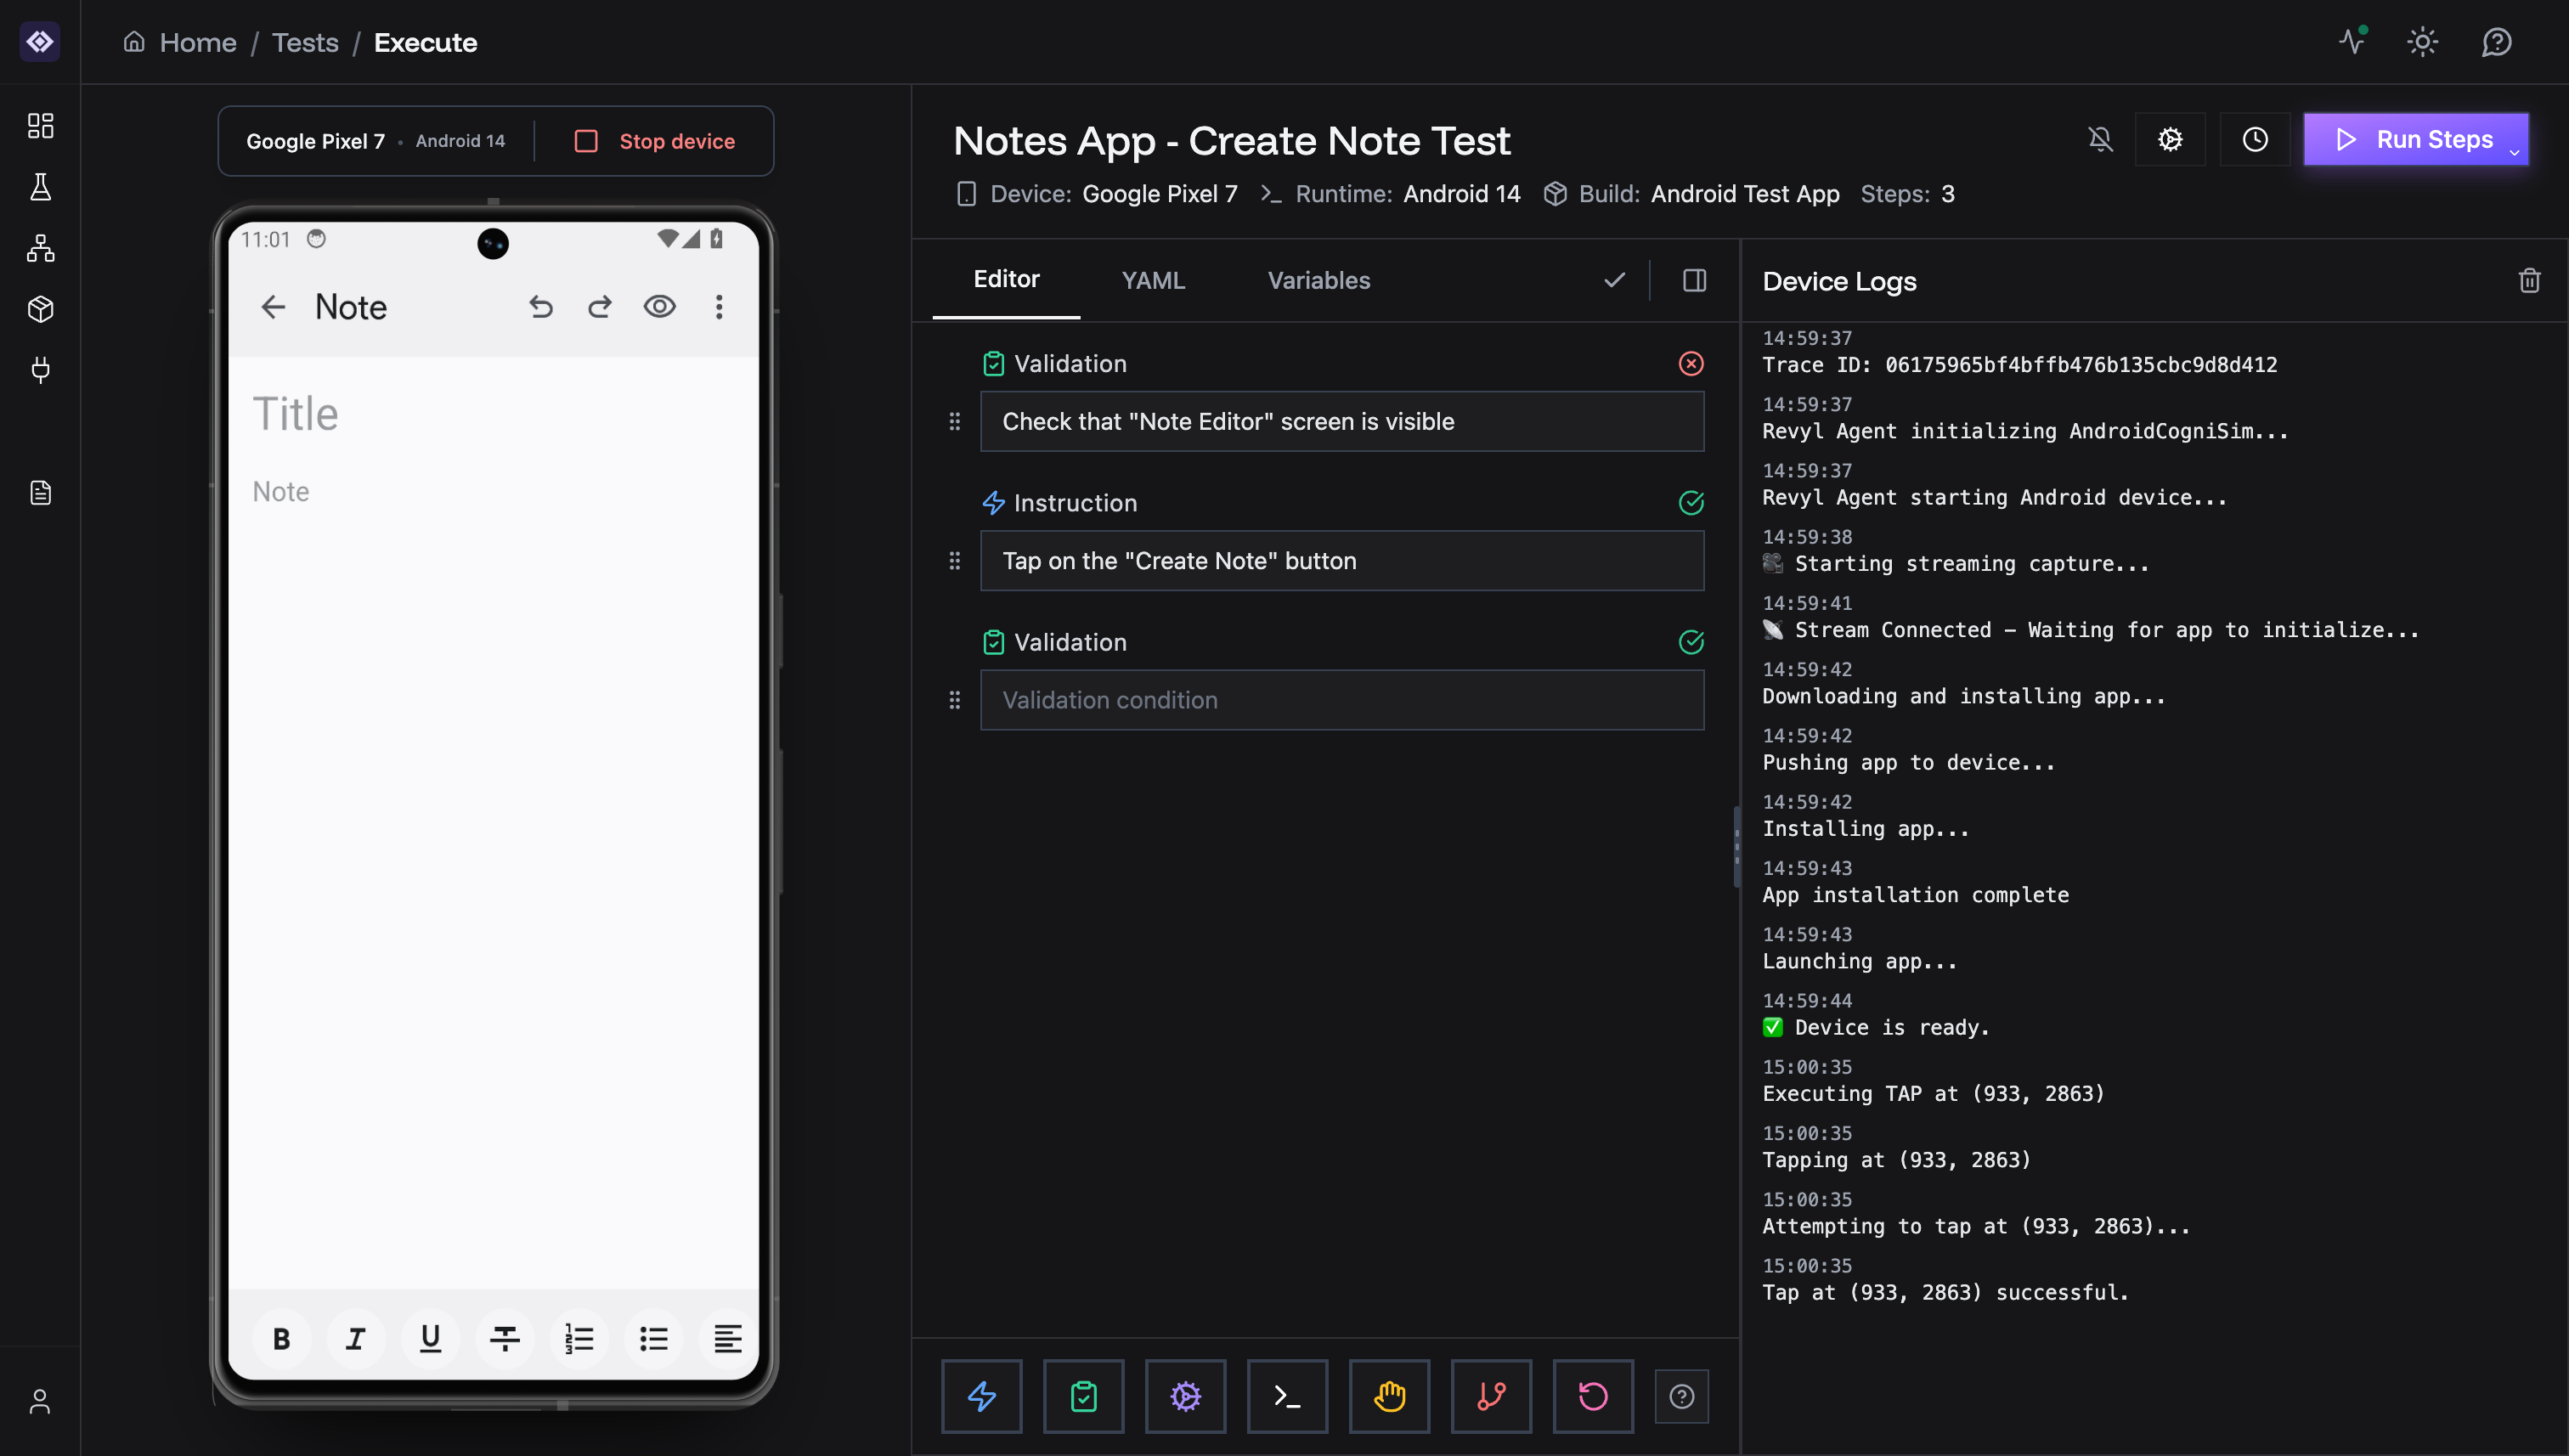
Running Tests
To run your test:- Ensure device is connected (live screen visible)
- Click Run Steps button in the top right
- Watch execution in real-time on the device screen
- Check Device Logs for system output
- Review results when complete
Test Controls
Top toolbar buttons:- Notification Bell - Get browser notifications when a device is done booting or steps complete (ensure your browser has permissions!)
- Settings - Configure test options
- History - View past test runs
- Run Steps - Execute all steps
- Device: Selected device model
- Runtime: OS version
- Build: Associated app build
- Steps: Current step count
Device Logs
The Device Logs panel shows real-time system output:- Application logs
- System messages
- Error output
- Execution events
Best Practices
- Start simple - Add one step at a time and test
- Use validations - Verify expected outcomes after actions
- Describe steps clearly - Descriptive text helps debugging
- Check device logs - Look for errors during execution
Next Steps
Need help? Contact [email protected]